


Advertisement
Advertisement
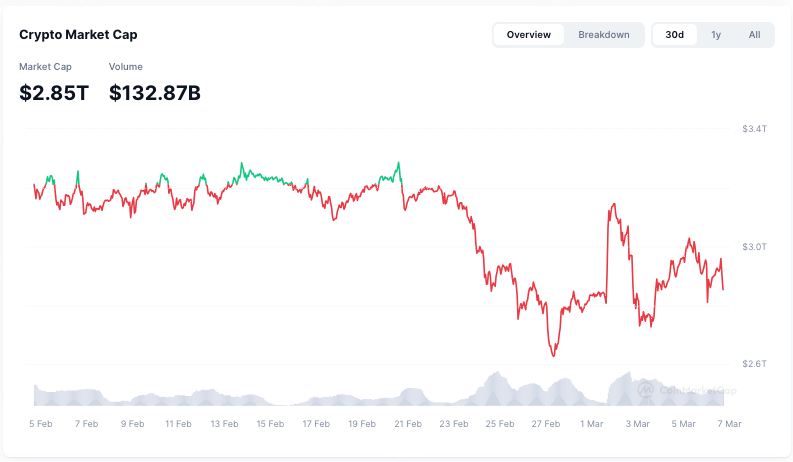
BNB and DOT Retest Key Supports as Market Sells Off Ahead of Crypto Summit
Published: Mar 07, 2025, 17:59 GMT+00:00
Key Points:
- Cryptos are dropping ahead of Trump’s crypto summit.
- BNB found support at $550 but hourly price action favors a bearish outlook.
- DOT could retest its $4 support as a double top pattern pops up.

BNB trading volumes have experienced a mild increase of 11.5% compared to the past day and currently sit at $1.8 billion. Meanwhile, DOT’s daily volumes have gone up 54% as buyers have shown up to scoop up the asset ahead of Trump’s crypto summit.
The President is scheduled to meet with top executives from crypto exchanges, blockchain companies, and experts in the field who will share their views about how America could be turned into the “world’s crypto capital.”
Meanwhile, employment data came in below expected levels as the unemployment rate for last month rose by 4.1% while 151,000 new job positions in the private sector were created in February compared to 160,000 that analysts forecasted for this period.
BNB Bounces Off $550 But Hourly Chart Shows Lower High
Despite today’s recovery, BNB has gone down by 14.5% since the year started. The price chart shows that the downtrend accelerated in late February and has pushed BNB to retest a critical support area in the past few days.
Thus far, BNB has bounced off the $550 level and momentum indicators have picked up steam ahead of Trump’s crypto event. The President’s crypto reserve announcement was largely irrelevant to BNB as it was never considered a plausible candidate.
As negative momentum keeps decreasing, traders should keep an eye on the Relative Strength Index (RSI) as a break above the signal line could prompt BNB to retest the $638 level first and possibly the $670 level if the rally accelerates.
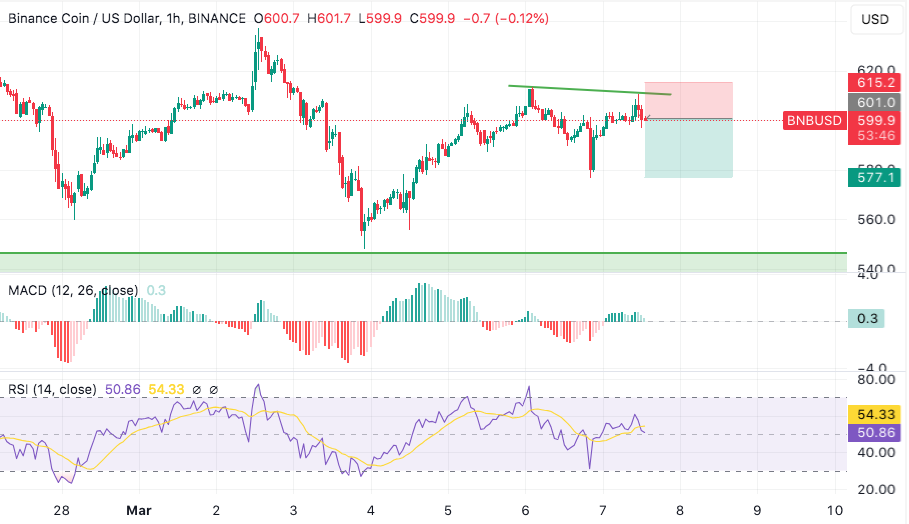
However, the 1-hour shows that BNB has made a lower high, meaning that the uptrend could be losing steam. The Relative Strength Index (RSI) has already sent a sell signal and the MACD shows steadily decreasing momentum readings.
A short position offers the most upside potential at the moment if BNB crosses below the $590 level as that could push the token to drop even further, possibly to retest its Thursday lows. This results in a 1.7 risk-reward ratio using the latest lower high as the stop price.
DOT Finds Support at $4 Temporarily
Meanwhile, Polkadot (DOT) has experienced less volatile price swings compared to other cryptocurrencies. The chart shows that DOT has been confined within a price channel since February started.
This kind of predictability is advantageous to some extent as the odds of a favorable outcome are higher. However, it also keeps gains relatively limited and increases the importance of securing the right entry price.
DOT bounced off its February 3 support yesterday. Momentum indicators have not yet sent a buy signal but the Relative Strength Index (RSI) is above the signal line already.
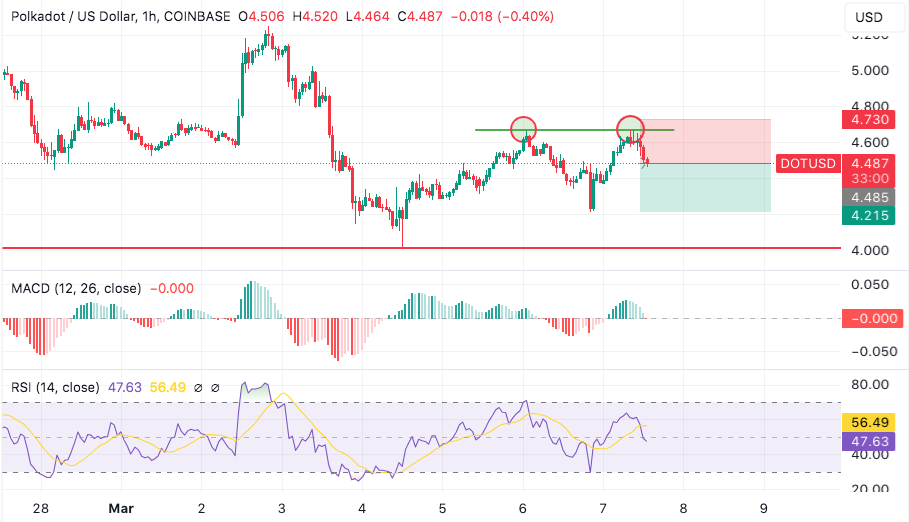
Moving into the hourly chart, DOT made a double-top once it hit the $4.67 level and has already been retreating from that level in the past few hours. The Relative Strength Index (RSI) has moved below the signal line while the MACD has posted its first negative momentum reading already.
These indicators favor a bearish short-term outlook that could push DOT to the $4.2 area first and, ultimately, retest the $4 support if the downturn accelerates.
About the Author
Alejandro Arriecheauthor
Alejandro Arrieche specializes in drafting news articles that incorporate technical analysis for traders and possesses in-depth knowledge of value investing and fundamental analysis
Did you find this article useful?
Latest news and analysis


Advertisement