
Bitcoin’s dormant coins are mass-moving again: What it means for BTC
![Bitcoin's [BTC] Open Interest Delta exhibited signs that might feel familiar to experienced traders.](https://ambcrypto.com/wp-content/uploads/2025/05/Kelvin-_6_-1200x675.webp)
- Bitcoin’s Open Interest Delta mimics patterns that preceded past price surges.
- A dip in the 180-day Delta may signal a market bottom or fresh accumulation cycle.
Bitcoin’s [BTC] Open Interest Delta exhibited signs that might feel familiar to experienced traders.
The 30-day consolidated Delta reached levels not seen since 2024, when Bitcoin jumped above $73K to reach its all-time high.
That moment in history now seems to be repeating, with the same pattern emerging across derivatives’ metrics.
Two clear phases are playing out
The Open Interest (OI) cycle has generally been explained by analysts as having two phases. Phase 1 is marked by a rapid accumulation of positions—this usually shows a positive Delta.
And then Phase 2, where the positions begin to unravel, reversing the Delta into being negative. This back-and-forth process shows a rhythm of leverage and sentiment.
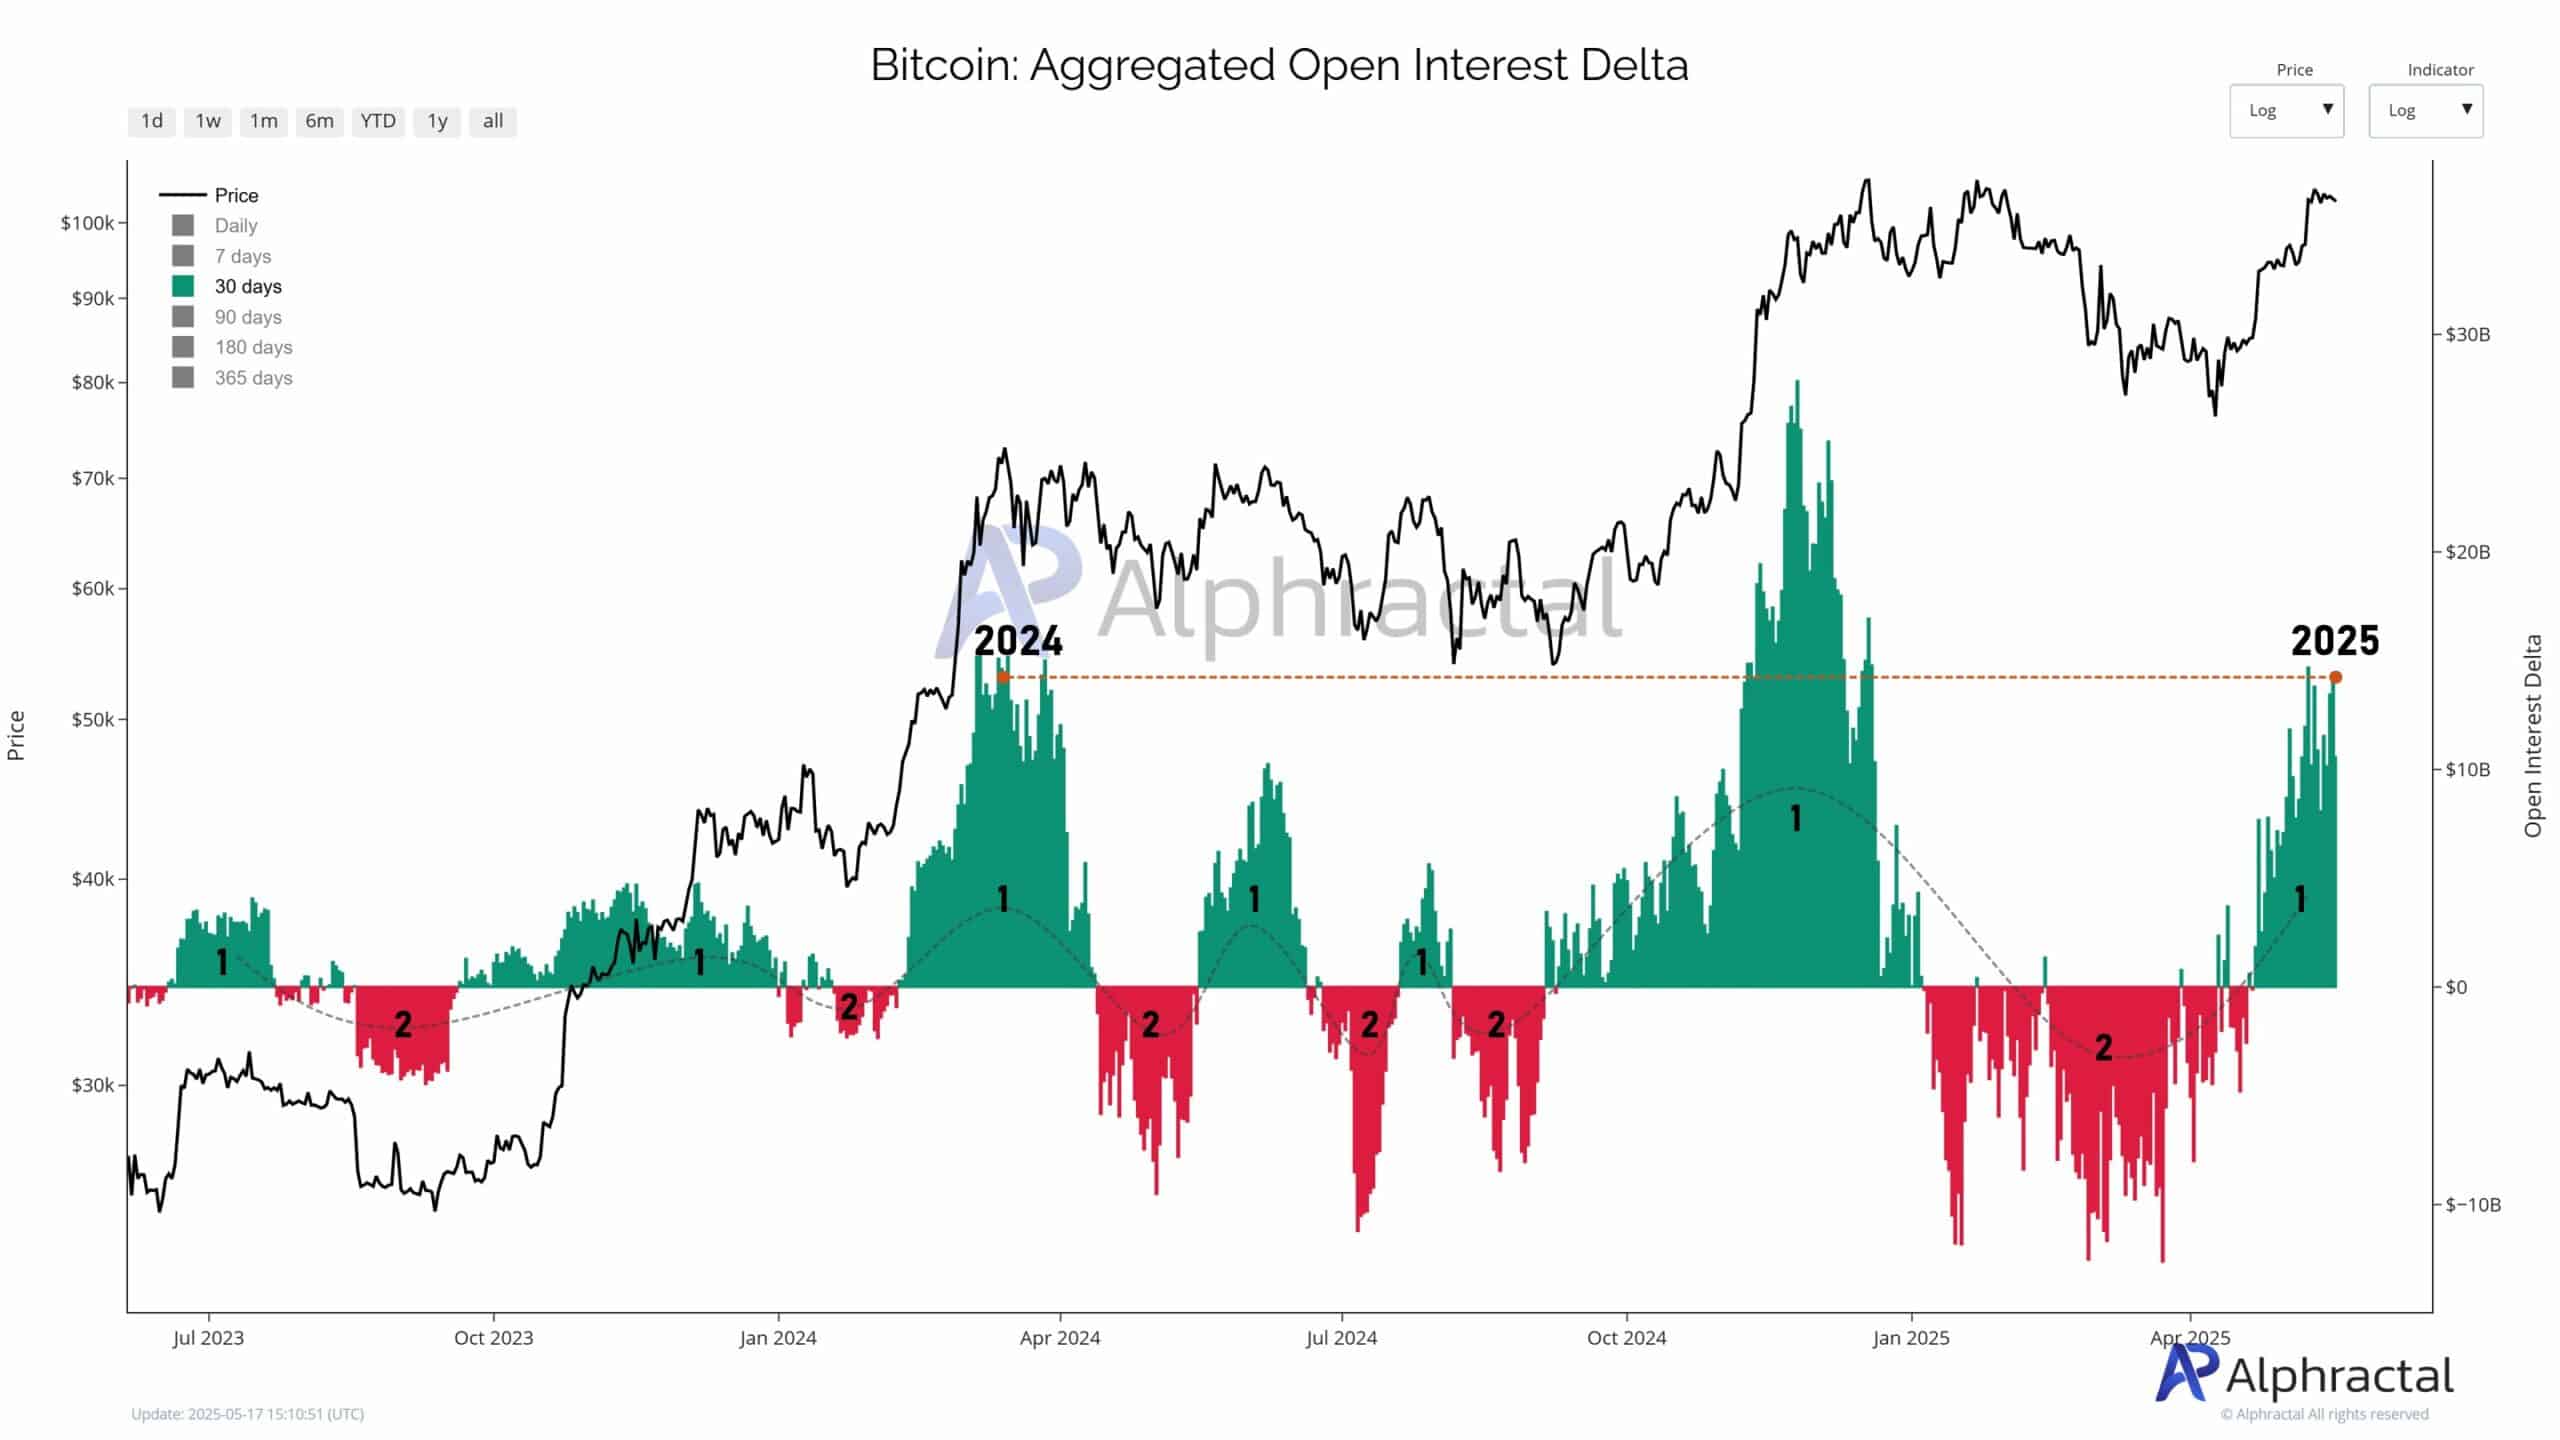
Source: Alphractal
At the time of writing, data from Alphractal shows we may be entering another Phase 1. And like in previous Bitcoin bull runs, the pace and form of this trend are being observed.
What the 180-day Delta reveals
Looking beyond the short term, the 180-day OI Delta is more informative.
In the past, sudden drops in Bitcoin Delta foreshadowed massive liquidations. These events tend to soak through over-leveraged long positions. Interestingly, they often coincide with market bottoms.
At press time, the 180-day Delta hovers just above zero. If it flips red, it could mark the start of another accumulation phase.
This transition is often where large investors begin quietly loading up.
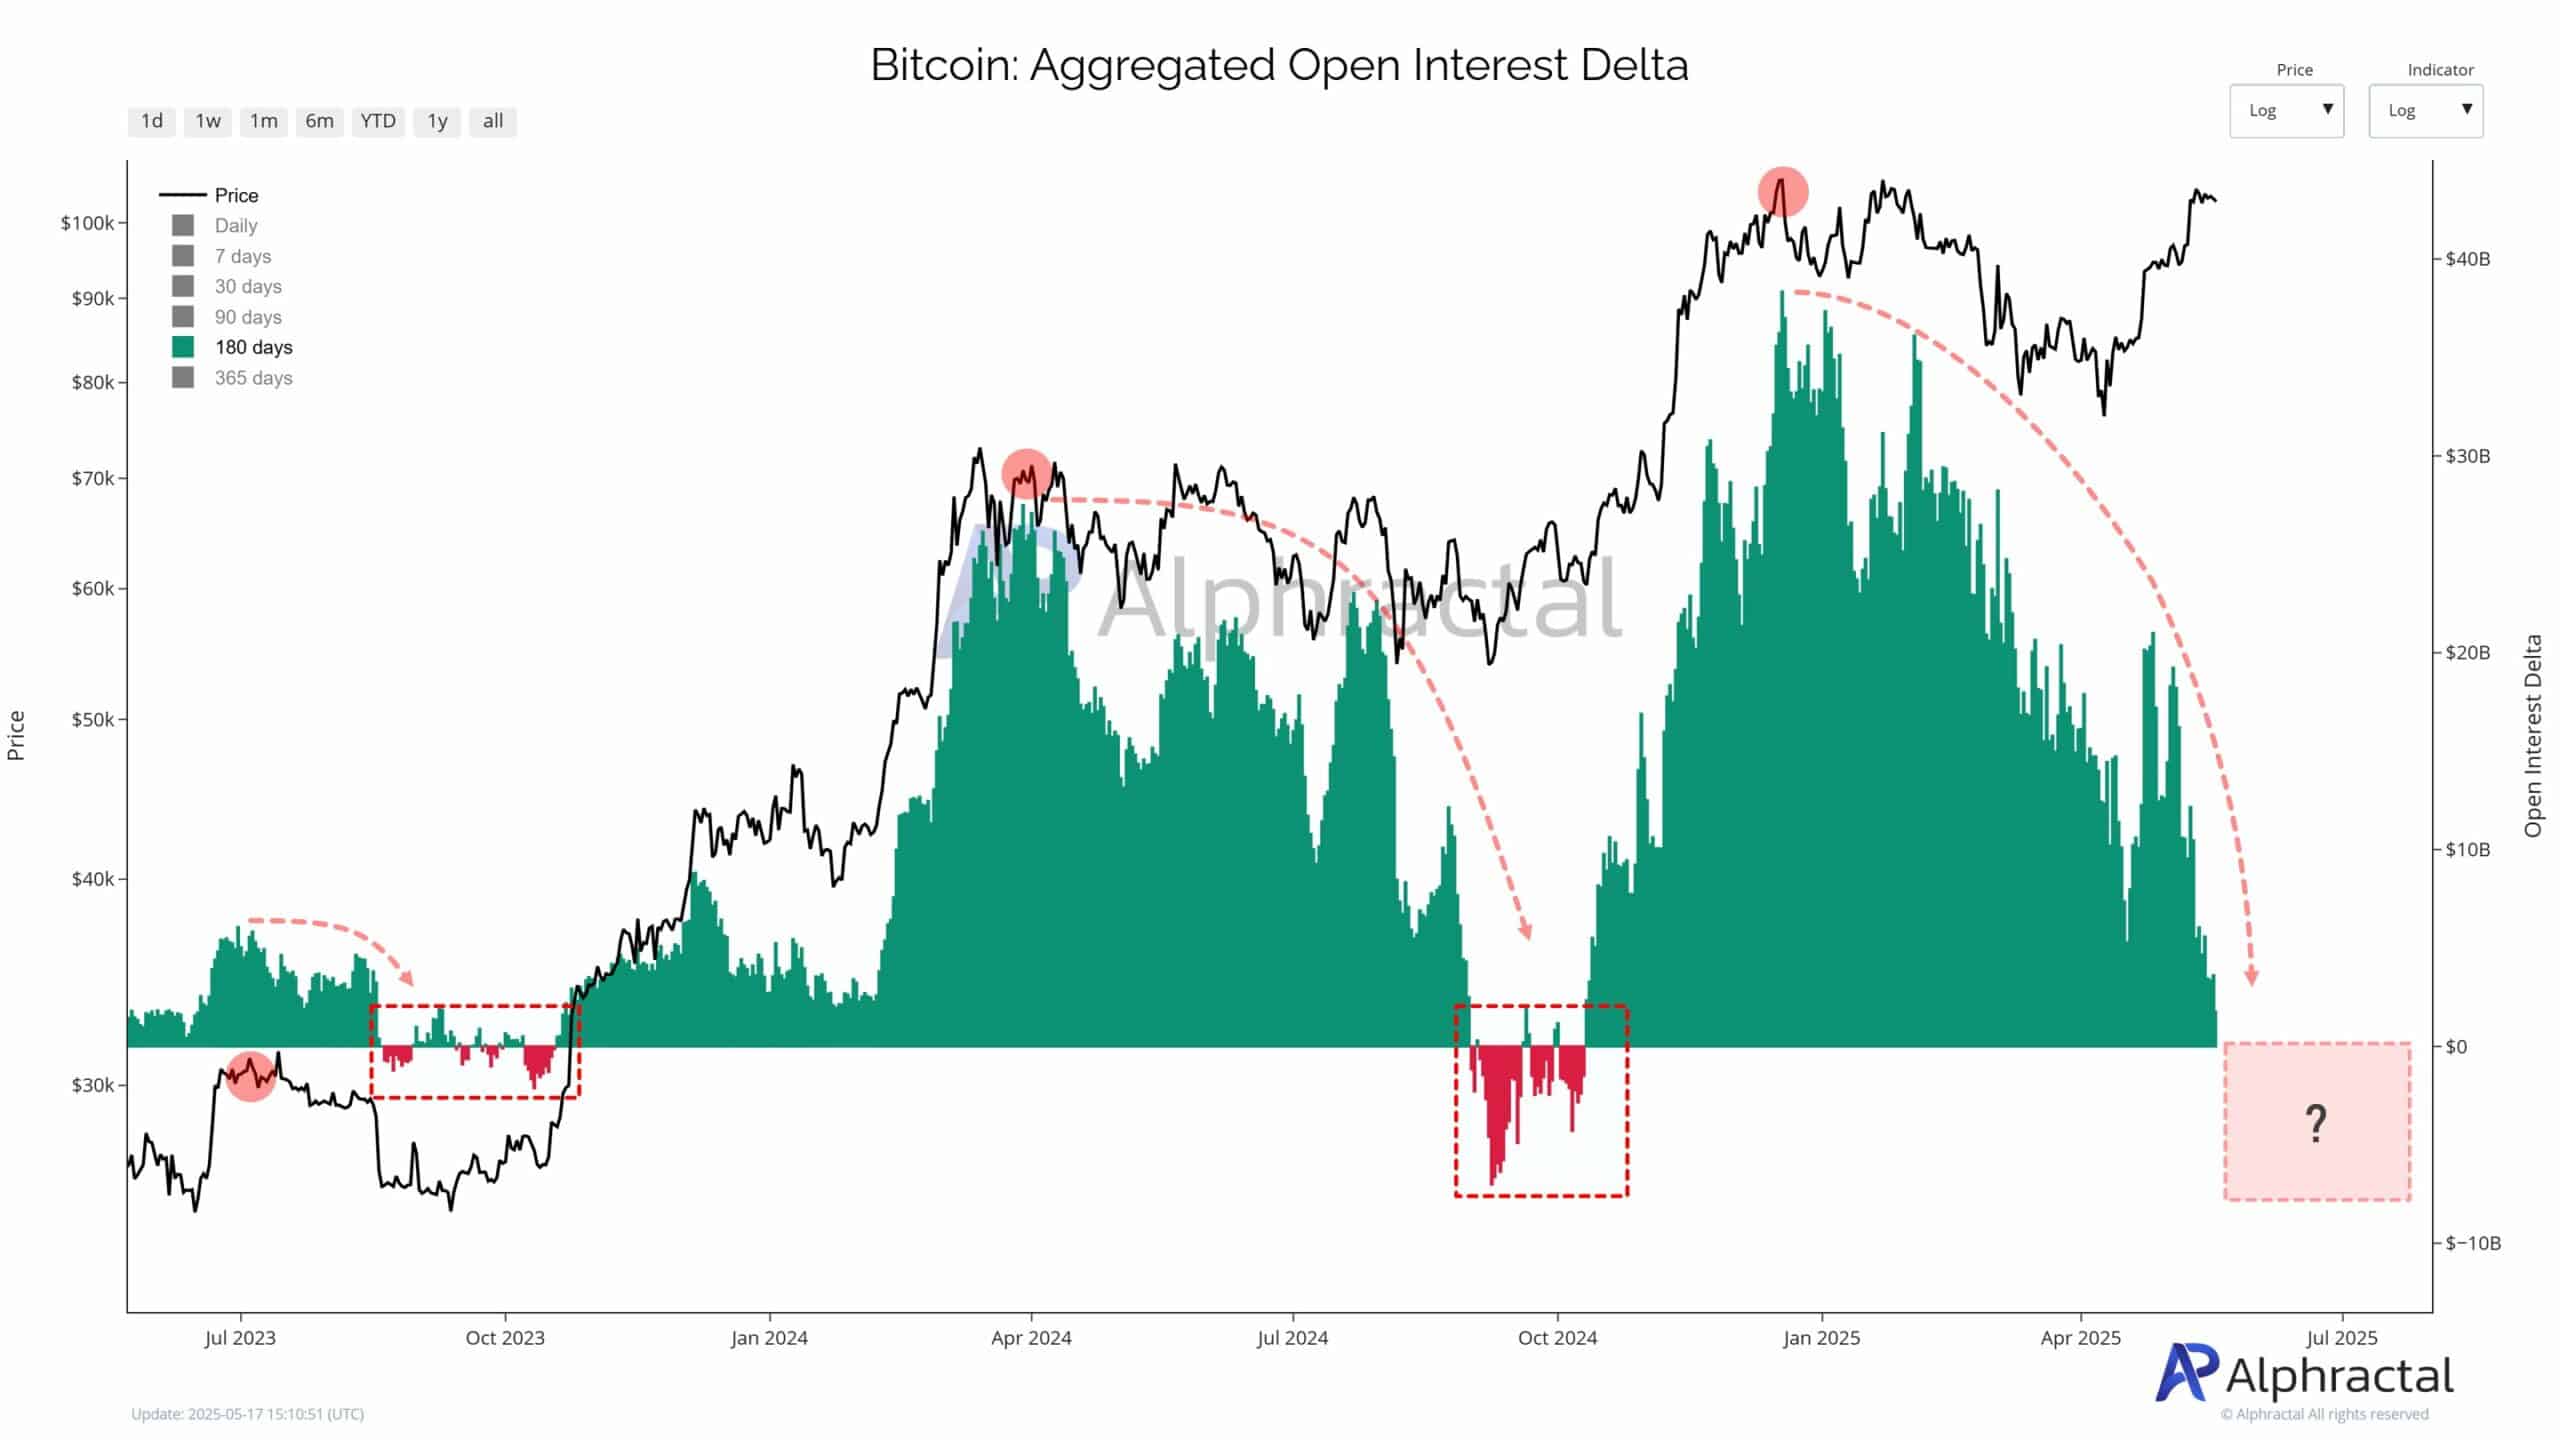
Source: Alphractal
Bitcoin whales are following a familiar pattern
Over the past two years, similar Delta shifts have preceded major Bitcoin rallies, notably in October 2023 and early 2024. During those periods, aggressive OI spikes signaled strong upward momentum.
However, this time, the pattern has changed. OI has not surged as sharply, suggesting that large players are adopting a more cautious approach.
This behavior aligns with how whales typically operate—they drive market momentum but withdraw strategically, making their movements important to watch.


