
Abstract
Bitcoin, introduced in 2008 by Satoshi Nakamoto, revolutionized the digital economy by enabling decentralized value storage and transfer, eliminating the need for a central authority. This paper presents a large-scale, temporally annotated graph dataset representing Bitcoin transactions, designed to advance research in blockchain analytics and beyond. The dataset comprises 252 million nodes and 785 million edges, with each node and edge timestamped for temporal analysis. To support supervised learning, we provide two labeled subsets: (i) 34,000 nodes annotated with entity types, and (ii) 100,000 Bitcoin addresses labeled with entity names and types. This dataset is the largest publicly available resource of its kind, addressing the limitations of existing datasets and enabling advanced exploration of Bitcoin’s transaction network. We establish baseline performance using graph neural network models for node classification tasks. Furthermore, we highlight additional use cases, including fraud detection, network analysis, and temporal graph learning, demonstrating its broader applicability beyond Bitcoin. We release the complete dataset, along with source code and benchmarks, to the public.
Background & Summary
Bitcoin1 is a set of concepts and technologies that underpin a decentralized digital economy, introduced in 2008 by the pseudonymous entity Satoshi Nakamoto. At its core, Bitcoin enables the storage and transfer of value between participants without reliance on a central authority. The term ‘Bitcoin’ encompasses multiple dimensions: the protocol governing the economy’s rules, the peer-to-peer network of participants, the blockchain (a public ledger recording all transactions), and the unit of value within the economy (denoted with a lowercase ‘bitcoin’).
Bitcoin distinguishes itself from traditional economies by eliminating the need for centralized control over inflation or transaction validation. Instead, it relies on a distributed, peer-to-peer system that ensures adherence to the rules of the economy through cryptographic proof and consensus mechanisms. Since its inception, Bitcoin has experienced significant adoption. By 2023, the average daily number of users reached 270,000, with approximately $8.6 trillion transferred through the network in the same year (Glassnode, https://glassnode.com, 2023). Additionally, Bitcoin has attracted substantial interest from the scientific community, with over 30,000 research papers indexed annually on Google Scholar over the past five years (https://scholar.google.com/scholar?q=bitcoin).
The need for public datasets in Bitcoin research
Despite the public availability of all Bitcoin transaction data, there is a notable scarcity of curated datasets available for researchers. The Bitcoin community has primarily focused on improving key aspects of the network, including security2,3, scalability4, and utility5, while addressing risks such as security vulnerabilities and financial crimes6,7. However, the lack of accessible, well-structured datasets hinders progress in understanding the Bitcoin ecosystem and its implications.
Analyzing Bitcoin transaction graphs has emerged as a critical area of research. These graphs provide essential insights into the health and growth of the network8, enabling researchers to study transaction patterns, detect anomalies, and identify potential risks. For instance, transaction graph analysis can reveal patterns associated with criminal activities such as money laundering, fraud, and other malicious behaviors9. By detecting anomalies in transaction flows, researchers can contribute to a deeper understanding of the Bitcoin economy and develop strategies to mitigate threats. The decentralized nature of Bitcoin presents both challenges and opportunities for researchers. On one hand, the transparency of the blockchain ensures that all transaction data is publicly available. On the other hand, the sheer volume and complexity of this data make it difficult to extract meaningful insights without proper tools and datasets. The development of standardized, publicly available datasets would significantly enhance the ability of researchers to study Bitcoin’s dynamics, assess risks, and propose solutions to emerging challenges.
Most existing Bitcoin datasets provide labeled sets of addresses6,10, requiring researchers to construct transaction graphs and associate addresses with graph nodes. While this approach offers flexibility, it imposes significant barriers: researchers must download blockchain data, extract relevant information, develop graph construction methodologies, and apply curation and processing techniques. These tasks demand advanced expertise in Bitcoin, limiting accessibility for researchers. Although some open-source graph-form datasets are available-such as Elliptic 1 and Elliptic 211,12, developed by the blockchain forensic firm Elliptic-their scope remains narrow. Elliptic 1 comprises 204 thousand nodes (transactions) and 234 thousand directed edges (fund flows), while Elliptic 2 includes 122 thousand graphs with 49 million nodes (users) and 196 million edges (transactions). Both datasets employ binary node labeling (licit or illicit), making them suitable for money laundering research but less applicable to broader investigations.
In this work, we introduce a large-scale, temporally resolved Bitcoin transaction graph designed to overcome these limitations. The graph represents real entities - organizations, individuals, or institutions within the Bitcoin network-as nodes, and value transfers between them as directed edges. The identification of the true identity of the nodes is not possible due to the pseudonymous nature of the Bitcoin addresses so no privacy concern can be raised. Spanning nearly 13 years of data, the graph includes 252 million nodes, 785 million edges, and 670 million transactions, making it the largest publicly available dataset of its kind. Each node and edge is timestamped, enabling temporal analysis. Additionally, the graph is richly labeled, with 34,000 nodes annotated by entity type and 100,000 Bitcoin addresses linked to named entities and types.
To demonstrate the dataset’s utility, we train graph neural networks (GNNs) in a supervised manner to predict entity types, such as ransomware operators or Ponzi schemes. This classification, combined with transaction graph analysis, enables deeper insights into transaction patterns and supports applications such as early detection of malicious activities (e.g., ransomware fund collection) and regulatory efforts (e.g., fund tracing). Our results establish baselines for future research and highlight the dataset’s potential to enhance the security and transparency of the Bitcoin ecosystem.
The remainder of this paper is organized as follows. We first detail the methodology for graph construction and curation, followed by the node labeling strategy. Next, we present the GNN training framework and its application to node classification. Finally, we discuss use cases extending beyond Bitcoin research, demonstrating the dataset’s broad applicability.
Framework of Bitcoin
Bitcoin relies on asymmetric cryptography, with each user possessing several private keys to secure and spend their funds1. These private keys are never revealed to the network; instead, pseudonyms are computed from these private keys to identify the user on the network13,14. In the following, different types of pseudonyms will be collectively referred to as addresses. The network’s units of value, bitcoins, are stored in data chunks called transaction outputs (TXOs). A TXO is defined by a value v (in satoshis, 1 satoshi = 10−8 bitcoin) and a locking script p that specifies the conditions to spend v14. Generally, p specifies addresses derived from private keys that can spend v. A Bitcoin transaction is characterized by an initial set of TXOs, which are consumed and destroyed to fund the transaction, and a second set, which is created as a result of this transaction14. A transaction is valid if the input value is greater than or equal to the output value, and if the input TXOs exist (i.e., they were created by previous transactions) and have not yet been spent. A TXO that has not yet been spent is called an unspent transaction output (UTXO). The output TXOs can then be used as inputs for future transactions. A single transaction can gather multiple entities as inputs and outputs. A transaction can thus be viewed as a transformation of one set of TXOs into another, altering the value distribution among entities. A transaction is illustrated in Fig. 1.

Schematic of a transaction Δ. Nodes with a single (resp. double) border represent TXOs (resp. transactions). TXOs consumed by Δ originate from prior transactions, while those created in Δ may serve as input TXOs in subsequent transactions.
Methods
Graph construction
Raw data extraction
All transactions since the inception of the Bitcoin economy are stored in a public ledger called the Bitcoin blockchain15. The blockchain is maintained through a decentralized network of peers16. Every ten minutes, a new block of transactions is appended. After installing Bitcoin Core (https://bitcoin.org/en/bitcoin-core) version 24.0, we set up a Bitcoin node with the standard configuration. The node allowed us to connect to the network of peers and download the complete transaction ledger. The entire transaction history was saved in the local blockchain data directory, specifically within the ‘blkXXXXX.dat’ files located within the ‘blocks’ folder created by the node. Subsequently, we used parsing techniques to extract all transaction details. This process ensured accurate data for our analysis. In this work, we considered the transactions contained within the first 700,000 blocks of the blockchain. In this work, we considered the transactions contained within the first 700,000 blocks of the blockchain, as this range precedes the activation of the Taproot upgrade17. Taproot introduced significant modifications to Bitcoin’s transaction structure, necessitating additional adaptations to the data processing methods employed. By focusing on blocks prior to this upgrade, the analysis remains consistent and avoids potential methodological complications.
Definition of nodes
All circulating bitcoins are allocated within unspent TXOs, each safeguarded by a locking script. Several TXOs can be locked by the same script, and thus can be spent by the same address or group of addresses. Furthermore, a transaction can be conceptualized as a transfer of value from one set of scripts to another. In this sense, scripts can be regarded as the owners of the bitcoins they lock. Consequently, locking scripts naturally emerge as candidates for the nodes within the graph dataset. All TXOs and scripts that have existed can be inferred from transaction data. In our analysis, TXOs with a zero value have been excluded, and we have identified over 874 million scripts.
A script is derived from a set of private keys held by one or more entities, thus making these entities the de facto owners of the bitcoins protected by the script. Typically, a user may possess multiple private keys for purposes of management, security, or privacy14. Additionally, the derivation of a locking script from a set of private keys is not unique18. As a result, a user generally owns or has owned bitcoins within TXOs protected by different scripts. For a more effective study of Bitcoin, it is preferable to analyze value transfers between real entities or users rather than scripts. This approach has been adopted in most previous research papers preceding this work6,7,8. Therefore, it is necessary to identify and cluster scripts that likely belong to a single entity, which will then represent a node in the graph.
To achieve this, we employed heuristics developed in previous research19. These heuristics leverage established behavioral patterns and habits of Bitcoin users, along with known human biases, to establish links between scripts appearing in the same transaction. Consequently, the nodes in our graph represent clusters of scripts, with approximately 252 million clusters identified. Each cluster is identified by a unique integer alias. Henceforth, a TXO will be characterized by a value v and the alias a representing the cluster of its locking script. Since the locking scripts are also derived from private keys, we will refer to them as addresses hereafter.
Edges
A transaction is the transformation of a set of input TXOs Δin into a new set of output TXOs Δout. There is nothing to prevent an alias from being present in both the inputs and the outputs. This situation is common, for example, when receiving change from a payment, as all input TXOs will be fully consumed regardless of the payment amount. Since an alias can appear in both the input and the output of a transaction, it needs to be determined whether this alias sends or receives value during the transaction. We define the value received by an alias a using the equation (1). This value is simply the difference between the value received in the output and the value spent in the input.
Consequently, the entity denoted as a can be classified as a recipient if the net value received is positive, otherwise a is a sender. The quantity transmitted from sender a to recipient \({a}^{{\prime} }\) is defined as the proportion of the total input value provided by a times the value received by \({a}^{{\prime} }\). An edge is finally drawn from each sender to each recipient of the transactions considered.
CoinJoin and colored coin transactions
CoinJoin refers to a specific type of transaction that adds a layer of privacy to Bitcoin20. The transaction ledger is public, and each transaction can be analyzed, making it relatively simple to follow value flows. Specifically, for a given user, it is straightforward to trace their wealth, from whom they receive value, and to whom they send it, which seriously compromises their privacy. CoinJoin works by combining multiple individual transactions from different users into a single large transaction. Each participant contributes input TXOs and specifies output TXOs without revealing which inputs belong to which outputs. As a result, it obscures the origin and destination of transactions, making it harder for external observers to trace the transfer flow of a particular user. This type of transaction also helps to thwart certain clustering heuristics by leading them to cluster together scripts that do not belong to the same user. For all these reasons, we have decided to exclude these transactions from (1) the construction of script clusters and (2) the addition of edges in the graphs. The construction of this type of transaction is facilitated by specialized software, with several implementations available, including Wasabi (https://docs.wasabiwallet.io) and Whirlpool/Samourai (https://github.com/Samourai-Wallet/Whirlpool). We used heuristics developed in previous work to detect these transactions20. These heuristics were developed by analyzing the open-source implementations of these software implementations to identify recognizable patterns in such transactions.
Colored coin transactions are utilized to transfer value in forms other than bitcoin, including other cryptocurrencies and tangible assets21. These transactions embed additional information, such as the type of asset or the quantity being transferred, within the transaction’s locking script, making them relatively straightforward to identify. To accurately detect these transactions, we devised heuristics based on established protocols like Open Asset (https://github.com/OpenAssets), Omni Layer (https://github.com/OmniLayer), and EPOBC (https://github.com/chromaway/ngcccbase/wiki/EPOBC_simple). Consequently, we exclude these transactions from our graph construction to maintain the integrity of our analysis by focusing on standard Bitcoin transactions.
Attributes
Attributes attached to edges represent the aggregate characteristics of the directed value transfers. Attributes attached to nodes are primarily derived from the edges involving those nodes, providing insights into the nodes’ transactional behavior. The different attributes are described in Tables 1 and 2. The blockchain is a chain of blocks, each containing a sequence of transactions. When defining the attributes, the block index of a transaction refers to the index of the block containing the transaction within the blockchain. Consequently, the block index can be regarded as a timestamp.
Overview of the dataset construction
The graph dataset consists of two tables: one table containing the nodes and their attributes, and another table containing the edges and their attributes. The dataset construction process required multiple steps and involved the creation of several intermediate tables. The construction process is illustrated in Fig. 2. All code is written in Python and is publicly available to ensure reproducibility. We use PostgreSQL (https://www.postgresql.org) for data storage in a database and the Python package Psycopg2 (https://www.psycopg.org) to query the database.
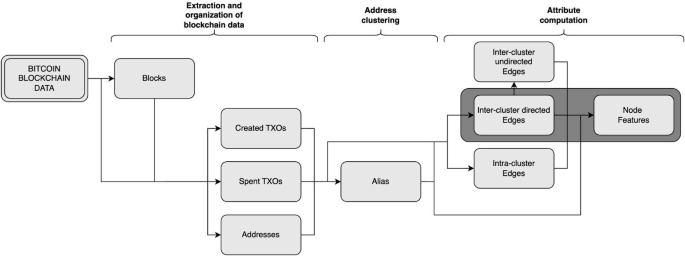
Dataset construction process. Simple rectangles represent PostgreSQL tables constructed during the process, while the darker section corresponds to the final dataset.
The code is organized as follows:
-
1.
Block indexing The transaction blocks downloaded with the Bitcoin node are stored in several thousand binary files. These blocks are organized in the order they are received from peers rather than their chronological position in the blockchain. To facilitate data reading, we create a table that contains the location of each block along with various metadata.
-
2.
Transaction processing The blocks and their transactions are read in chronological order. For each transaction, we store the TXOs created in the transaction in the ‘CreatedTXO’ table. Similarly, we store the spent TXOs in the ‘SpentTXO’ table. This allows for efficient retrieval of transaction-related data. During this step, we identify CoinJoin and colored coin transactions to exclude them from future analyses. In parallel, we list each encountered locking script (address) in a table.
-
3.
Address clustering In this step, we construct address clusters. Initially, each address forms its own cluster. As we process transactions and apply clustering heuristics, clusters merge until they form the final clusters, which represent the nodes in our graph. We use a disjoint-set data structure to efficiently store and merge clusters. The final clusters are stored in the ‘Alias’ table in the form of (address, cluster).
-
4.
Inter-cluster edges At this stage, we have identified the node corresponding to each address found in the transaction data. This allows us to determine the owning node of each TXO. We then use equation (1) to calculate value transfers within a transaction. As we process transactions, we add directed edges representing value transfers between nodes to the ‘TransactionEdge’ table. If an edge between two nodes already exists, its attributes are updated accordingly. From the ‘TransactionEdge’ table, we also construct the ‘UndirectedTransactionEdge’ table, which contains undirected edges between nodes. This table is useful for calculating the node degrees.
-
5.
Intra-cluster edges By repeating the previous step but staying at the level of TXOs owned by addresses, we construct the ‘ClusterTransactionEdge’ table, which contains undirected edges representing value transfers occurring within the same address cluster. This table is useful for computing certain node features.
-
6.
Node attribute computation The attributes of the nodes are computed by reading the tables constructed in steps 3, 4, and 5, using simple counting operations as well as additional operations such as summation, minimum, and maximum calculations.
Node labels
Various real-world entities with distinct motivations utilize Bitcoin, including individuals, government organizations, corporations, service providers, and criminal organizations. Extensive research efforts in Bitcoin are dedicated to examining the behavior and dynamics of value transfers among these diverse entities. These studies are invaluable for providing insights into the purposes and motivations behind Bitcoin usage. Bitcoin users are identified by randomly generated addresses. Information from the blockchain alone is insufficient to ascertain the true identity or nature of the entity represented by an alias. At no stage does the labeling process, nor the final labels, disclose any information pertaining to individual humans, thereby eliminating any privacy concerns.
Entities that have often been studied in prior research include single individuals and those connected to malicious or criminal activities, such as Ponzi schemes, ransomware operators, or mixers6,9,22. Other analyzed entities include participants in Bitcoin’s economic activity, such as miners, exchanges, marketplaces, and faucets, as well as those linked to entertainment, like sports betting and gambling platforms7,8,23. Given the expansion of the crypto-economy beyond Bitcoin, we propose studying ‘bridges,’ which facilitate value transfers between different crypto-economies. Therefore, we aim to focus our investigation on the following categories of entities:
-
Individual
-
Mining: individual or entity that validates and confirms transactions on the Bitcoin network.
-
Exchange: online platform that facilitates the buying, selling, and trading of cryptocurrencies and fiat currencies.
-
Marketplace: online platform where users can buy and sell goods or services using bitcoin as the primary form of payment.
-
Gambling: online platform where users can wager and play casino games, sports betting, and participate in lotteries using Bitcoin.
-
Bet: address created by a gambling service specifically for receiving funds related to a unique bet.
-
Faucet: promotional tool that rewards users with small amounts of bitcoin for completing tasks or viewing advertisements.
-
Mixer: service that enhances the privacy and anonymity of transactions by making it more difficult to trace transactions on the blockchain.
-
Ponzi: a financial scheme promising high returns to investors by using funds from new investors to pay returns to earlier investors.
-
Ransomware: malicious software that encrypts files on a victim’s computer, demanding payment to decrypt and restore access.
-
Bridge: protocol that facilitates the exchange of assets between Bitcoin and different blockchain networks (e.g. Ethereum).
These entities were selected due to their relevance and prevalence within the cryptocurrency ecosystem, providing a comprehensive overview of the diverse actors within the Bitcoin ecosystem.
Summary
In this experimental framework for Bitcoin research, we leverage BitcoinTalk (https://bitcointalk.org), a prominent online forum, to extract and analyze Bitcoin-related data. Using a Python-based scraper with Selenium (https://www.selenium.dev), we systematically collected 14 million messages from 546,000 threads, focusing on posts mentioning Bitcoin addresses. These addresses were then associated with entities (e.g., services, companies) using ChatGPT (https://openai.com/chatgpt), a large language model fine-tuned for contextual understanding. ChatGPT was prompted to identify deposit addresses, hot/cold wallets, and withdrawal transactions based on post content, transaction IDs, and USD amounts converted using the Bitstamp exchange rate. The full labeling pipeline is illustrated in Fig. 3. This approach enabled the labeling of 34,000 nodes and 100,000 Bitcoin addresses with entity types, such as ransomware operators or Ponzi schemes, by mapping forum discussions to predefined categories. However, the dataset has limitations, including potential inaccuracies from user-generated content, biases toward English-speaking entities, and challenges in extracting precise information from unstructured text. Despite these constraints, ChatGPT demonstrated high accuracy (83-96%) in extracting relevant details from forum posts. This methodology provides a scalable, automated pipeline for constructing a large-scale, labeled Bitcoin transaction graph, facilitating advanced research into transaction patterns, entity behaviors, and malicious activities within the Bitcoin ecosystem. The integration of forum data and AI-driven labeling offers a novel approach to overcoming the scarcity of curated datasets in blockchain research.

Labeling pipeline.
BitcoinTalk
BitcoinTalk is an online forum dedicated to Bitcoin, and it remains one of the most active forums on the subject. The forum is divided into several sections, subsections, and threads. A thread is a sequence of messages or posts, which should be related to the thread’s topic or title. Bitcoin addresses are often mentioned in posts, and the context of the thread can sometimes help to assign these addresses to entities, such as services or companies. We developed a Python-based scraper utilizing the Selenium (https://www.selenium.dev) package to systematically collect posts from the English-speaking section of the forum. Threads in this section often comprise multiple messages distributed across several pages. The scraper initiates its operation by accessing the first page of a thread to extract its posts and then proceeds to navigate through subsequent pages to retrieve all remaining posts. For each post, the scraper captures the textual content, a unique author identifier, and the publication date. We collected the data at the end of 2023. In total, we collected 14,067,713 messages from 546,440 threads.
ChatGPT
Addresses were assigned to entity names using ChatGPT, an artificial intelligence assistant developed by OpenAI based on the GPT24 foundation models. ChatGPT is designed to engage in human-like automated conversations with users. The GPT models have been fine-tuned using supervised learning and reinforcement learning from human feedback. A conversation consists of a sequence of user prompts and assistant responses. ChatGPT has demonstrated impressive results in various tasks, including following instructions and solving logic problems25. We utilized ChatGPT (model ‘gpt-4o-mini’) via API calls (https://platform.openai.com) for this purpose.
Deposit addresses, hot and cold wallets
We concentrated on addresses owned by organizations, especially those providing services in exchange for bitcoins. Transactions between user addresses and service addresses are relatively common across various services26. To access these services, users deposit funds by transferring bitcoins from their personal addresses to addresses managed by the organization, known as deposit addresses27. Organizations typically generate unique deposit addresses for each client, simplifying the monitoring of client deposits. However, these addresses remain under the organization’s control. Once funds are deposited from personal addresses to the deposit addresses, users can utilize the service in exchange for the bitcoins they have deposited. Users can withdraw their remaining bitcoins to personal addresses after they have finished using the service. Typically, funds from deposit addresses are consolidated into two types of addresses: hot wallets and cold wallets28. Hot wallets are internet-connected and hold sufficient funds for routine operations like user withdrawals. Conversely, cold wallets are generally offline to protect against online threats and store the bulk of the service’s funds and user deposits. Based on this typical interaction pattern and observations from the collected posts, we designed instructions for ChatGPT to extract information about the addresses mentioned in the posts.
Prompts
We have formulated several prompts to guide ChatGPT in associating addresses mentioned in a post with an entity name, provided that the context (the post and the thread title) allows for it. In addition to the textual information within the post, we incorporate supplementary data. Certain posts include transaction IDs, which serve as unique identifiers of transactions on the blockchain. This enables readers to retrieve detailed transaction information from the blockchain, thereby providing additional context. Since this detailed transaction information can also help ChatGPT, we included transaction details (senders, recipients, amounts) of the mentioned transaction IDs in the prompt. Although all amounts on the blockchain are denominated in satoshis, posters frequently refer to amounts in USD in their posts. To assist ChatGPT in matching amounts in bitcoins in transactions with the USD amounts mentioned in the posts, we added the converted USD amounts using the BTC/USD exchange rate from the date of the post. We obtained the daily conversion rate from the Bitstamp exchange using their official API (https://www.bitstamp.net/api).
All prompts are available in the code directory (see ‘Code availability’). The first script is designed to detect bitcoin deposits from customers to a service. Posters usually mention deposit addresses or transaction IDs when they encounter issues during their deposit, such as their account not being credited with the correct amount of bitcoin. This script associates mentioned deposit addresses with entity names if the context allows. The second script targets users’ withdrawals. When users want to withdraw their funds, they provide a recipient address to the service. The service then creates the transaction and communicates the transaction ID once it is incorporated into the blockchain. Withdrawal transactions are typically funded by the service’s funds, likely controlled by hot wallets. For this reason, we assume that the sending addresses of these transactions are owned by the identified service. The third script is quite similar; it also attempts to detect withdrawals and aims to identify the involved entity, the address used by the user, and the amount withdrawn. We refer to the previous case by searching the blockchain for the corresponding withdrawal transaction, around the date of the post ( + /− three days), with the withdrawal address as the output receiving the indicated amount. If a unique transaction matches these characteristics, we assume it is the withdrawal transaction, and the addresses funding this transaction belong to the detected entity. Finally, the last script identifies hot and cold addresses under various circumstances.
Labeling
Prompts have been meticulously crafted to ensure the assistant returns a succinct reasoning along with an entity name and Bitcoin addresses or transaction ids. A mapping between the returned entity names and the predefined entity categories has been established. This mapping process utilized threads from BitcoinTalk where entity names were mentioned and the Internet Wayback Machine (https://web.archive.org). In cases where the name of an entity was unknown, often because services had ceased operations or failed to achieve prominence, we manually navigated BitcoinTalk forum threads, focusing on those referencing the entity, to infer the type of service provided. When posts included URLs, we attempted to access the corresponding websites to gather additional context. For websites that were no longer operational, we employed the Internet Wayback Machine to retrieve historical snapshots of the webpages. If the entity type could not be determined following these procedures, the pair was excluded from the dataset to maintain the integrity and reliability of the labels. For each labeled address, we identified and labeled the locking scripts that can be unlocked by the address with the same label as the address. Subsequently, for each labeled script, we assigned the corresponding cluster/node the same label. In instances where a cluster contains multiple conflicting labels, no label was assigned.
Limits
Posts retrieved from BitcoinTalk may contain inaccuracies, misinformation, or deliberate falsehoods posted by users. Users may misrepresent the context of a transaction or intentionally provide misleading information about the ownership or purpose of certain addresses. These inaccuracies may stem from the pseudonymous nature of the forum users, which can make it challenging to verify the authenticity of claims. Furthermore, the dataset may reflect biases due to its reliance on self-reported or community-shared information, which could disproportionately highlight certain types of entities or behaviors while omitting others.
Additionally, since we only fetched posts from the English-speaking part of the forum, the constructed dataset of labels may not be representative of all entities globally. This language constraint could lead to an underrepresentation of non-English-speaking users and entities, potentially skewing the node labels toward regions and communities more active in English-language discussions.
Moreover, despite advancements in large language models such as ChatGPT and others, extracting information from short, unstructured text remains a significant challenge. Online discussions often lack sufficient contextual clarity, contain ambiguous references, or exhibit inconsistent formatting, hindering precise information retrieval. To evaluate the model’s capability in extracting the desired information, we conducted an assessment using samples drawn from all available posts. Specifically, for each prompt, we selected 150 posts containing at least one Bitcoin address or transaction identifier. The evaluation metric was the proportion of posts in which all relevant details were correctly identified and extracted. For the deposit address extraction prompt, we filtered posts containing the keywords ‘deposit’, ‘deposited’, ‘transfer’, and ‘transferred’ to maximize the presence of relevant addresses. Our analysis showed that ChatGPT successfully extracted complete information from 138 out of 150 posts (92%). For the withdrawal address and transaction prompts, we selected posts mentioning ‘withdraw’, ‘withdrew’, ‘withdrawn’, and ‘withdrawal’. The results indicate high extraction accuracy, with 96% for withdrawal transactions and 86% for withdrawal addresses. For the hot and cold wallet address extraction prompt, we selected posts containing the terms ‘hot’ and ‘cold’. ChatGPT correctly extracted information from 83% of the posts. These findings demonstrate that ChatGPT effectively extracts information from forum posts.
Other sources
To enrich our dataset, we incorporated additional data from diverse sources.
-
We have incorporated wallet addresses from various cryptocurrency exchanges, as provided by the exchanges themselves. Several exchanges publicly disclose the addresses of their hot and cold wallets to enhance transparency and demonstrate their custody of customer funds. We manually collected these addresses directly from the official websites of the respective exchanges. The URLs where these addresses were found are listed in Table 3. The addresses are directly available on the link’s page or are contained in a file that can be downloaded from the page.
Table 3 Sources of cryptocurrency exchange wallet addresses. -
We collected 29 addresses from DefiLlama (https://defillama.com/cexs), specifically those associated with the exchanges Coinsquare, Gate.io, Swissborg, Latoken, Woo, and Cakedefi. These addresses can be accessed by selecting the exchange on the DefiLlama CEX page, then clicking on the Wallet Addresses button, which redirects to a GitHub page containing the respective addresses.
-
Our collection of ransomware addresses was expanded by incorporating addresses identified in previous research papers, including the two Padua ransomware datasets (https://spritz.math.unipd.it/projects/btcransomware/)6 and the Montréal ransomware dataset (https://doi.org/10.5281/zenodo.1238041)10,29. These addresses were compiled from public sources such as security reports, academic publications, and online databases that list Bitcoin addresses linked to illegal activities.
-
We also integrated addresses from the Specially Designated Nationals (SDN) List (https://sanctionslist.ofac.treas.gov/Home/SdnList) maintained by the U.S. Department of Treasury. The addresses are available in the ‘SDN.XML’ file. The selected entities from this list include ‘Suex’, ‘Chatex’, and ‘Garantex’ (all labeled as exchanges), ‘Hydra’ (marketplace), and ‘Blender.io’ (mixer).
-
Additionally, we included addresses holding bitcoins related to the bridge Wrapped Bitcoin (https://wbtc.network/dashboard/audit), categorizing them under ‘bridge’.
-
Bitcoin addresses were also extracted from user profiles on BitcoinTalk. Forum users often include their personal Bitcoin addresses in their profiles or signatures, displayed below their posts. We scraped the profiles of all forum posters from previously collected messages, labeling each identified address as ‘individual’.
-
Furthermore, we incorporated addresses associated with mining entities. Miners earn rewards for incorporating new transactions into the blockchain through special transactions known as Coinbase transactions. Miners have the ability to include a message in these transactions; some mining companies may embed their name or a distinctive pattern. These messages allow us to identify and categorize these addresses under ‘mining’.
-
Lastly, we included addresses related to betting and gambling platforms. Some platforms, such as Fairlay and DirectBet, enable customers to participate in bets by sending bitcoin to specific addresses created for each bet. Users can share their bets on forums like BitcoinTalk via URLs that redirect to the bet, which include the Bitcoin deposit addresses. We developed regex patterns to detect these URLs, extract the addresses, and classify them as ‘bet’.
All addresses obtained in this subsection, except for the 29 addresses from DefiLlama, are included in the dataset (see ‘Data Records’). However, these excluded addresses can still be accessed through the provided links.
Data Records
The latest release of the dataset is accessible at https://doi.org/10.6084/m9.figshare.26305093.v3, under a Creative Commons Attribution 4.0 International license30.
Bitcoin addresses dataset
The file ‘addresses.csv’ contains all 103,812 labeled addresses obtained during the ‘Node labeling’ section. In Tables 4 and 5, we present the distribution of categories among the labeled addresses, as well as the distribution of label sources.
Graph dataset
The features of the 252,219,007 nodes and the 785,954,737 edges are stored in a compressed PostgreSQL database, organized in the form of tables. These tables are structured to facilitate efficient querying and analysis of Bitcoin transaction data. The descriptions of these tables are provided in Table 1 and Table 2. The graph’s density is approximately 1%, indicating that it is very sparsely connected. The density of a graph is a measure of the proportion of edges present compared to the maximum possible number of edges in the graph. This suggests that only a small fraction of possible directed edges are present, reflecting a network with minimal direct interactions between nodes. In total, 34,098 nodes are labeled. We have plotted the distribution of categories among the labeled nodes in Fig. 4a. We have also plotted the evolution of the number of nodes and edges in the graph as a function of the timestamp (block index in the blockchain) in Fig. 4b.

Statistics on the nodes and edges of the graph. (a) Distribution of categories among the labeled nodes. (b) Evolution of the number of nodes (solid line) and edges (dotted line) in the graph as a function of the block index.
Technical Validation
Predicting the label of a node based on its attributes serves as a validation method for our dataset. This approach establishes a robust connection between off-chain data, the entity type behind a cluster, and on-chain activity data. The successful prediction of these labels underscores the dataset’s reliability and relevance, justifying its utility across various applications.
Task and models
The learning task consists of predicting the ‘label’ column for labeled nodes. We specifically predict the labels: ‘exchange’, ‘mining’, ‘gambling’, ‘ponzi’, ‘individual’, ‘ransomware’, and ‘bet’, as these are sufficiently represented in the dataset. For this task, we consider the graph as undirected. We trained four different state-of-the-art graph neural networks (GNNs): GCN31, GraphSage32, GAT33, and GIN34. GNNs can handle complex relationships and dependencies between entities represented by nodes and edges in a graph. They leverage the connectivity patterns and node features to learn representations that capture the structure and features of the graph, making them suitable for tasks like node classification. For these models, we used the implementation provided by the PyTorch Geometric (https://www.pyg.org) package with the following hyperparameters: 2 layers, ReLU activations, 256 hidden units, and a dropout rate of 0.1. The GAT network was used with 8 attention heads, and we used a 2-layer perceptron with 256 hidden cells to map the node features for the GIN network. To compare the performance of these models with more traditional machine learning approaches, we also trained a gradient boosting classifier (GBC). A GBC is a machine learning algorithm that builds an ensemble of decision trees sequentially to improve prediction accuracy, used on tabular data without relationships between samples, i.e., the feature vectors of the labeled nodes. For this, we used the implementation from the Scikit-learn (https://scikit-learn.org) package with default parameters.
Additional features
We added features derived from the existing features that appeared useful for our task. We calculated the average amounts received and sent, the proportion of non-isolated addresses within the cluster, the out-degree/in-degree ratio, and the time before the first transaction (first_transaction_out − first_transaction_in), if applicable. We also defined the age of a node, as shown in equation (2), as the difference in the number of blocks between its last activity and its first activity.
The older an entity, the more likely it is to have created numerous addresses and conducted many transactions. We believe that temporal activity rates of a node are more informative than its absolute activity values. For this reason, we divided certain features by the age of the node, specifically the attributes total_transaction_in and total_transaction_out, as well as degree and cluster-type attributes. Even though transaction amounts are in bitcoin, the network users are part of traditional economies. For this reason, Bitcoin users often think in terms of dollars rather than bitcoins, especially given the significant increase in Bitcoin’s price since its inception, making it challenging to compare two quantities in bitcoin. For these reasons, we converted each value-type attribute to USD terms. To achieve this, we used the historical BTC/USD conversion rates to calculate a median satoshi price over the node’s activity period.
Pre-processing
The features exhibited a probability density that followed a power law distribution, except at very large values. To enhance learning and accelerate convergence, we processed the features using the following pipeline: (1) replacing zero values with NaNs, (2) applying logarithmic transformation, (3) normalization, (4) clipping the values between 0 and 1, and (5) replacing any missing values with 0. For normalization, each feature was adjusted using its minimum value q0% and the 95th percentile q95% through the following transformation: \(x\to \frac{\log (x)-\log ({q}_{0 \% })}{\log ({q}_{95 \% })-\log ({q}_{0 \% })}\). For value-type features, smaller values did not adhere well to a power law distribution. Therefore, we substituted the minimum value in the aforementioned formula with the 5th percentile. All normalization constants were computed based on the training set.
Training
We divided the labeled nodes into training, validation, and test splits with distributions of 40%, 30%, and 30%, respectively, and maintained these distributions across all experiments. To address class imbalance and enhance training performance, we employed oversampling for underrepresented labels and undersampling for overrepresented labels, ensuring that each label had between 300 and 1500 samples. Our models were trained using the Adam optimizer to minimize the weighted cross-entropy loss function provided by the Pytorch (https://pytorch.org) package. The weights for each label were set inversely proportional to the number of samples of that label in the training set, with the weights normalized so that the average was 1. We set the batch size to 32 and the learning rate to 10−4, and 3 × 10⁻⁴ for the GAT network.
Scalability considerations
Training GNNs on large-scale datasets, such as the one presented in this work that contains over 252 million nodes, presents significant computational and memory challenges. The iterative message-passing mechanisms of GNNs, combined with the sheer size of the graph, make full-graph training highly resource-intensive. To address these challenges, we considered well-established scalability strategies. Neighborhood sampling methods, such as GraphSAGE32, reduce the computational and memory requirements by sampling a subset of neighbors for each node during training. This approach enables efficient mini-batch training while retaining sufficient local graph structure for learning. Another complementary approach involves distributed training, where the graph is partitioned across multiple machines or GPUs for parallel computation. Frameworks such as DGL (https://www.dgl.ai) and PyTorch Geometric facilitate distributed training, though inter-machine communication overhead must be carefully managed35. In this work, our goal was to predict the class of labeled nodes, which represented only 0.014% of all nodes in the graph. This low proportion allowed us to restrict computations to neighborhoods centered around these labeled nodes. Given these conditions, we adopted neighborhood sampling due to its simplicity, scalability, and effectiveness. This method enabled the construction of manageable subgraphs that reduce computational overhead without sacrificing the structural information required for effective training. The efficacy of this approach has been demonstrated in prior applications to large-scale graph datasets32,36.
Neighborhood sampling
For each labeled node, we sample its local neighborhood to construct subgraphs to be used during training. In this section, we describe the algorithm employed to perform this sampling. The sampling is characterized by a maximum depth kmax and a number of neighbors to explore at each depth. Given a depth \(1\,\le \,k\,\le \,{k}_{\max }\), a number of neighbors to be sampled nk, a set of already explored nodes \({{\mathscr{N}}}_{{\rm{prev}}}\), and a set of nodes to be explored, \({{\mathscr{N}}}_{{\rm{next}}}\), we proceed as follows. For each node n to be explored, let \({\mathscr{V}}(n)\) denote the neighbors of n that have neither been explored nor are currently being explored. If the number of such neighbors is less than nk, all of them are selected for the next depth; otherwise, nk neighbors are selected randomly without replacement. At the end of this loop, the nodes explored at the current depth are considered fully explored (\({{\mathscr{N}}}_{{\rm{prev}}}\,\leftarrow \,{{\mathscr{N}}}_{{\rm{prev}}}\cup {{\mathscr{N}}}_{{\rm{next}}}\)). The set of nodes to explore at the next depth, \({{\mathscr{N}}}_{{\rm{next}}}\), consists of all newly sampled neighbors. The neighborhood of a labeled node is obtained by starting exploration from the labeled node nseed. Thus, the neighborhood of a labeled node is the subgraph composed of all explored nodes and the nodes to be explored at the last depth, i.e., \({{\mathscr{N}}}_{{\rm{next}}}\cup {{\mathscr{N}}}_{{\rm{prev}}}\). We also add each edge between a node and its parent in the exploration process. The sampling process is illustrated in Fig. 5. In our experiments, we set the maximum depth to kmax = 2 and sampled 10 and 5 neighbors for the first and second steps, respectively.

Neighborhood sampling pseudo-code.
Finding the neighbors to explore for a node involves extracting all edges connected to the node from the dataset and deducing its neighborhood. This operation is particularly resource-intensive and time-consuming for high-degree nodes. To speed up the process, for nodes with a degree greater than 100,000, we requested only a random sample of the edges connected to the node. To achieve this, we used the sampling method ‘TABLESAMPLE SYSTEM’ in PostgreSQL.
Data augmentation
The neighborhood sampling process is inherently stochastic. By sampling multiple neighborhoods from the same labeled node, we effectively increase the total number of samples available for training and evaluation. This method of data augmentation can enhance the model’s generalization capacity and provides a more comprehensive assessment of the model’s performance and robustness. Given the computational expense of the sampling process relative to model training, we have implemented a buffer of pre-sampled neighborhoods. For each split of the labeled nodes (train, validation, and test), we created 12 split-datasets. Each split-dataset consists of a sampled neighborhood for each node belonging to the split. The normalization constants for preprocessing are derived from a randomly selected training split dataset prior to training. During the training phase, train and validation split-datasets were periodically (every 100 epochs) randomly selected from the buffer to continue the training process.
Results analysis
For each node in the test split, and for each neighborhood of this node, stored in the buffer, we computed the probability vector for each class using the trained GNNs. Subsequently, we calculated the mean probability vector by averaging the probability vectors obtained from all neighborhoods of the node. The final classification label for each node was determined by selecting the class with the highest mean probability. We compared the performance of different models using F1 score for each label and the average F1 score (macro-F1) over the different classes. The results are presented in Table 6. The F1 score is a measure of predictive performance for classification models, accounting for both false positives and false negatives, especially useful in imbalanced datasets. It ranges from 0 to 1, where 1 indicates perfect classification and 0 indicates the worst performance. We also included the performances of the Gradient Boosting Classifier (GBC).
Based on the presented results, node features are useful for predicting the entity type of a node. For instance, the Gradient Boosting Classifier achieves a macro-F1 score of 0.57, with relatively high F1 scores for the ‘gambling’, ‘individual’, and ‘bet’ classes. The higher scores of GraphSage, GAT, and GIN suggest that a node’s neighborhood is useful for prediction, which is particularly true for the ‘mining’, ‘ponzi’ and ‘bet’ classes. The GAT and GIN models, known for their high expressiveness, achieve the best results, with macro-F1 scores of 0.64 and 0.63, respectively. In contrast to the Gradient Boosting Classifier, GNNs struggle significantly to predict the ‘ransomware’ class.
We have presented in Table 7 the normalized confusion matrix for the trained GAT model. Each entry in the matrix is calculated by dividing the number of instances of the true label (row) classified as the column label by the total number of instances of the true label (row). There is a noticeable pattern of misclassification of various labels as ‘individual’, suggesting that the model may need further refinement in distinguishing ‘individual’ from other categories. Additionally, a non-negligible number of ransomware instances are misclassified as ‘exchange,’ indicating potential confusion between these two categories.
Feature importance analysis for gradient boosting classifier
For the gradient boosting classifier, feature importance can be computed to quantify the contribution of each feature to the model’s decision-making process. This metric provides insights into how much each feature influences the predictive performance. In scikit-learn, feature importance is represented as a normalized score between 0 and 1, where higher values correspond to greater relevance within the decision trees constructed by the model. Relative feature importance is derived by dividing each feature’s importance score by the maximum importance value among all features. Figure 6 presents the relative importance of the top 10 features.

Relative importance of the top 10 features as computed by the gradient boosting model.
The results indicate that the outgoing degree normalized by age has the highest relative importance, significantly outperforming other features. This metric likely captures the distinction between entities with a high number of outgoing connections, such as cryptocurrency exchanges or gambling platforms, and those with fewer connections. A similar pattern is observed for the cluster size normalized by age, as these entities often generate numerous individual deposit addresses for their clients, unlike Ponzi schemes or ransomware operators, which typically utilize a limited number of collection addresses. Furthermore, features derived from transaction statistics, such as the total received amounts, also exhibit substantial importance. These findings highlight the usefulness of engineered features, particularly those normalized by node age and those converted into USD values, in improving the classification performance of the model.
Potential for strengthening ransomware detection through subgraph algorithms
Previous research has demonstrated that malicious actors tend to form dense subgraphs in transactional networks, characterized by tightly interconnected groups of nodes37. To identify these clusters of fraudulent actors, methodologies inspired by works like Fraudar37 could be employed. Fraudar, which is considered among the state-of-the-art methods in fraud detection, uses a peeling algorithm to detect subgraphs that maximize both density and the average suspicion level of nodes. However, this method requires that a suspicion score, indicating the likelihood of being a malicious actor, is assigned to all nodes in the graph. This likelihood could be derived from the class probabilities output by our trained models, which were designed to predict the probability of each node belonging to a specific entity type. By adapting this approach, we could define the suspicion score of a node as its likelihood of being associated with ransomware activities. Furthermore, leveraging the temporal nature of the graph, iterative versions of these algorithms, such as Spade+38, could be applied. These methods have shown their effectiveness in identifying malicious actors in real time. Such advancements would provide significant opportunities for proactive identification of criminal activities within the Bitcoin network.
Usage Notes
Restoring the graph database
After decompressing the archive, the tables can be restored into an existing PostgreSQL database using the pg_restore utility as follows: pg_restore -j n_jobs -Fd -0 -U db_user -d db_name dataset. In this command, n_jobs is the number of threads to use to load the data and create indexes, db_username is the username to connect as, and db_name is the name of the PostgreSQL database. Once the data is loaded into the database, indexes on certain columns will be automatically created to accelerate data access in downstream tasks. The database requires substantial storage: 40GB for node_features and 80GB for transaction_edges (including indexes). We recommend provisioning sufficient storage to accommodate these tables. In our research, we configured several PostgreSQL parameters to optimize database performance. Specifically, we set shared_buffers to 1,048,576 (default: 16,384), work_mem to 16,384 (default: 4,096), maintenance_work_mem to 1,048,576 (default: 65,536), wal_buffers to 2,048 (default: -1), and max_parallel_workers_per_gather to 4 (default: 2). We recommend matching or exceeding these configurations to achieve optimal performance.
Use cases
We have demonstrated how this dataset can be used to predict the type of entity, such as Ponzi scheme operators or ransomware collection addresses. Using a predictive model, we can identify specific types of entities and track the funds associated with them. Since legitimate entities actively seek to avoid interactions with illegal or high-risk actors, the need for effective prediction mechanisms becomes crucial. If legitimate cryptocurrency exchanges can track funds linked to ransomware-related activities, they can prevent these illicit funds from being converted into fiat currencies on their platforms. By restricting access to fiat currencies, the operations of malicious actors are significantly disrupted, as fiat remains essential for their activities. This is especially critical given the high profitability of crypto-ransomware operations6.
There are some other exciting research directions yet to be explored using this dataset.
-
Study of interactions among different entity types based on value flows Previous research has particularly examined value flows associated with ransomware and other cybercriminal activities, tracing how extorted funds are laundered7,9,22. Additionally, the temporal dimension of the graph can help assess how interactions between different types of entities are influenced by political, regulatory, economic, and financial contexts.
-
Evolution of the graph over time This involves analyzing changes in the number of nodes and edges39,40, the graph’s connectivity and density, along with the identification of dynamically evolving zones over time. The graph traces user interactions from the inception of the network, capturing key phases in the adoption of this emerging economy, from its early marginal use to the gradual institutionalization of Bitcoin as a financial asset.
-
Comparison with other economies and networks Prior studies have explored the topological properties of the interaction graph among Bitcoin users40,41. These properties can be compared with those of other well-known networks, providing deeper insights into Bitcoin’s structural characteristics. Moreover, the large scale of this graph is beneficial for pre-training neural networks, which can later be fine-tuned for other graphs related to transactions, payments, or, more broadly, value transfers between real-world entities.
Finally, the dataset’s potential extends beyond the economic domain, offering valuable insights across various fields. By drawing analogies between value transfers and other types of flows, this dataset can be applied to diverse disciplines. In social network analysis, value transfers can be interpreted as exchanges of influence, information, or social capital, shedding light on network dynamics and power structures. Similarly, in supply chain networks, the dataset can help model the movement of goods and services, providing insights into efficiency and bottlenecks. This versatility highlights the dataset’s broad interdisciplinary applications, demonstrating its value in both financial and non-financial contexts.
Code availability
The code used in this research is available on GitHub. The repositories are detailed as follows:• BTCGraphConstruction (https://github.com/hugoschnoering2/BTCGraphConstruction): This repository contains the code for constructing the PostgreSQL database where the graph tables are stored.• BitcoinTalkScrapper (https://github.com/hugoschnoering2/BitcoinTalkScrapper): This directory contains the code for scraping posts from the BitcoinTalk forum.• BTCGraphLabeling (https://github.com/hugoschnoering2/BTCGraphLabeling): This repository includes the code for labeling Bitcoin addresses based on data collected from Bitcoin Talk threads and other data sources.• BTCGraphPredictingLabel (https://github.com/hugoschnoering2/BTCGraphPredictingLabel): This repository hosts the code for the prediction task presented in the Technical Validation section of the paper.
These repositories contain all the necessary code and documentation to replicate the results and methodologies discussed in this paper.
References
Nakamoto, S. Bitcoin: a peer-to-peer electronic cash. Bitcoin Org https://bitcoin.org/bitcoin.pdf (2008).
Maxwell, G., Poelstra, A., Seurin, Y. & Wuille, P. Simple schnorr multi-signatures with applications to bitcoin. Des. Codes Cryptogr. 87, 2139–2164, https://doi.org/10.1007/s10623-019-00608-x (2019).
Eyal, I., Gencer, A. E., Sirer, E. G. & Van Renesse, R. Bitcoin-ng: A scalable blockchain protocol. 13th USENIX symposium on networked systems design implementation (NSDI 16), 45–59 (2016).
Poon, J. & Thaddeus, D. The bitcoin lightning network: Scalable off-chain instant payments. Lightning network https://lightning.network/lightning-network-paper.pdf (2021).
Andreianova, M., Sonntag, S., Antikainen, T., Alho, C. & Blomberg, J. Bitcoin usage: Study on bitcoin usage around the world 2020. The J. FinTech 1, 2150005, https://doi.org/10.1142/S270510992150005X (2021).
Conti, M., Gangwal, A. & Ruj, S. On the economic significance of ransomware campaigns: A bitcoin transactions perspective. Comput. & Secur. 79, 162–189, https://doi.org/10.1016/j.cose.2018.08.008 (2018).
Gomez, G., Moreno-Sanchez, P. & Caballero, J. Watch your back: Identifying cybercrime financial relationships in bitcoin through back-and-forth exploration. Proc. 2022 ACM SIGSAC conference on computer communications security, 1291–1305, https://doi.org/10.1145/3548606.3560587 (2022).
Tovanich, N. & Cazabet, R. Pattern analysis of money flow in the bitcoin blockchain. Int. Conf. on Complex Networks Their Appl. 443-455, https://doi.org/10.1007/978-3-031-21127-0_36 (2022).
Huang, D. Y. et al. Tracking ransomware end-to-end. IEEE Symp. on Secur. Priv. 618–631, https://doi.org/10.1109/SP.2018.00047 (2018).
Paquet-Clouston, M., Haslhofer, B. & Dupont, B. Ransomware payments in the bitcoin ecosystem. J. Cybersecurity 5, tyz003, https://doi.org/10.1093/cybsec/tyz003 (2019).
Weber, M. et al. Anti-money laundering in bitcoin: Experimenting with graph convolutional networks for financial forensics. Preprint at https://doi.org/10.48550/arXiv.1908.02591 (2019).
Bellei, C. et al. The shape of money laundering: Subgraph representation learning on the blockchain with the elliptic2 dataset. Preprint at https://doi.org/10.48550/arXiv.2404.19109 (2024).
Antonopoulos, A. M. in Mastering Bitcoin: Unlocking Digital Cryptocurrencies (2nd ed.), Ch. 4 (O’Reilly Media, 2017).
Antonopoulos, A. M. in Mastering Bitcoin: Unlocking Digital Cryptocurrencies (2nd ed.), Ch. 5 (O’Reilly Media, 2017).
Antonopoulos, A. M. in Mastering Bitcoin: Unlocking Digital Cryptocurrencies (2nd ed.), Ch. 2 (O’Reilly Media, 2017).
Antonopoulos, A. M. in Mastering Bitcoin: Unlocking Digital Cryptocurrencies 2nd edn, Ch. 6 (O’Reilly Media, 2017).
Wuille, P., Nick, J. & Towns, A. Bip 341 - taproot: Segwit version 1 spending rules. Bitcoin Improvement Proposals https://github.com/bitcoin/bips/blob/master/bip-0341.mediawiki (2021).
Antonopoulos, A. M. in Mastering Bitcoin: Unlocking Digital Cryptocurrencies (2nd ed.), Ch. 7 (O’Reilly Media, 2017).
Schnoering, H., Porthaux, P. & Vazirgiannis, M. Assessing the efficacy of heuristic-based address clustering for bitcoin. Preprint at https://doi.org/10.48550/arXiv.2403.00523 (2024).
Schnoering, H. & Vazirgiannis, M. Heuristics for detecting coinjoin transactions on the bitcoin blockchain. Preprint at https://doi.org/10.48550/arXiv.2311.12491 (2023).
Rosenfeld, M. Overview of colored coins. https://allquantor.at/blockchainbib/pdf/rosenfeld2012overview.pdf (2012).
Paquet-Clouston, M., Romiti, M., Haslhofer, B. & Charvat, T. Spams meet cryptocurrencies: Sextortion in the bitcoin ecosystem. Proc. 1st ACM conference on advances financial technologies 76-88, https://doi.org/10.1145/3318041.3355466 (2019).
Xiang, Y. et al. Babd: A bitcoin address behavior dataset for pattern analysis. IEEE Transactions on Inf. Forensics Secur. https://doi.org/10.1109/TIFS.2023.3347894 (2023).
Brown, T. et al. Language models are few-shot learners. Adv. Neural Inf. Process. Syst. 33, 1877–1901, https://doi.org/10.48550/arXiv.2005.14165 (2020).
Liu, H. et al. Evaluating the logical reasoning ability of chatgpt and gpt-4. Preprint at https://doi.org/10.48550/arXiv.2304.03439 (2023).
McCorry, P., Möser, M. & Ali, S. T. Why preventing a cryptocurrency exchange heist isn’t good enough. Secur. Protoc. XXVI 225-233, https://doi.org/10.1007/978-3-030-03251-7_27 (2018).
Makarov, I. & Schoar, A. Blockchain analysis of the bitcoin market. MIT Sloan https://mitsloan.mit.edu/sites/default/files/2022-06/Bitcoin-blockchain%20-%20AER.pdf (2021).
Antonopoulos, A. M. in Mastering Bitcoin: Unlocking Digital Cryptocurrencies (2nd ed.), Ch. 10 (O’Reilly Media, 2017).
Paquet-Clouston, M., Haslhofer, B. & Dupont, B. Ransomware payments in the bitcoin ecosystem. Zenodo https://doi.org/10.5281/zenodo.1238041 (2018).
Schnoering, H. & Vazirgiannis, M. Bitcoin temporal graph. Figshare https://doi.org/10.6084/m9.figshare.26305093.v3 (2025).
Kipf, T. N. & Welling, M. Semi-supervised classification with graph convolutional networks. Preprint at https://doi.org/10.48550/arXiv.1609.02907 (2016).
Hamilton, W., Ying, Z. & Leskovec, J. Inductive representation learning on large graphs. Adv. Neural Inf. Process. Syst. 30, https://doi.org/10.48550/arXiv.1706.02216 (2017).
Veličković, P. et al. Graph attention networks. Preprint at https://doi.org/10.48550/arXiv.1710.10903 (2017).
Xu, K., Hu, W., Leskovec, J. & Jegelka, S. How powerful are graph neural networks? Preprint at https://doi.org/10.48550/arXiv.1810.00826 (2018).
Zheng, D. et al. Distdgl: Distributed graph neural network training for billion-scale graphs. Work. on Irregul. Appl. Archit. Algorithms (IA3) 36-44, https://doi.org/10.48550/arXiv.2010.05337 (2020).
Ying, R. et al. Graph convolutional neural networks for web-scale recommender systems. Proc. 24th ACM SIGKDD international conference on knowledge discovery & data mining 974–983, https://doi.org/10.1145/3219819.3219890 (2018).
Hooi, B. et al. Fraudar: Bounding graph fraud in the face of camouflage. ACM SIGKDD international conference on knowledge discovery data mining 895–904, https://doi.org/10.1145/2939672.2939747 (2016).
Jiang, J., Chen, Y., He, B., Chen, M. & Chen, J. Spade+: A generic real-time fraud detection framework on dynamic graphs. IEEE Transactions on Knowl. Data Eng. 36, 7058–7073, https://doi.org/10.1109/TKDE.2024.3394155 (2024).
Filtz, E., Polleres, A., Karl, R. & Haslhofer, B. Evolution of the bitcoin address graph an exploratory longitudinal study. Proc. 1st Int. Data Sci. Conf. 77-82, https://doi.org/10.1007/978-3-658-19287-7_11 (2017).
Alqassem, I., Rahwan, I. & Svetinovic, D. The anti-social system properties: Bitcoin network data analysis. IEEE Transactions on Syst. Man, Cybern. Syst. 50, 21–31, https://doi.org/10.1109/TSMC.2018.2883678 (2018).
Tao, B. et al. Complex network analysis of the bitcoin transaction network. IEEE Transactions on Circuits Syst. II: Express Briefs 69, 1009–1013, https://doi.org/10.26599/TST.2021.9010080 (2021).
Acknowledgements
Hugo Schnoering acknowledges financial support from CoinShares for his PhD funding. The authors also thank Llama-Corp, the developer and maintainer of DeFiLlama, for granting them permission to use the 29 addresses collected from their platform.
Author information
Authors and Affiliations
Contributions
The first author conducted the engineering work needed (collection, cleaning, exploration of the data, experimental evaluation) and wrote the paper. The second author supervised the work, contributed to the design of the experimental evaluation, and reviewed the paper.
Corresponding author
Ethics declarations
Competing interests
The authors declare no competing interests.
Additional information
Publisher’s note Springer Nature remains neutral with regard to jurisdictional claims in published maps and institutional affiliations.
Rights and permissions
Open Access This article is licensed under a Creative Commons Attribution-NonCommercial-NoDerivatives 4.0 International License, which permits any non-commercial use, sharing, distribution and reproduction in any medium or format, as long as you give appropriate credit to the original author(s) and the source, provide a link to the Creative Commons licence, and indicate if you modified the licensed material. You do not have permission under this licence to share adapted material derived from this article or parts of it. The images or other third party material in this article are included in the article’s Creative Commons licence, unless indicated otherwise in a credit line to the material. If material is not included in the article’s Creative Commons licence and your intended use is not permitted by statutory regulation or exceeds the permitted use, you will need to obtain permission directly from the copyright holder. To view a copy of this licence, visit http://creativecommons.org/licenses/by-nc-nd/4.0/.
About this article

Cite this article
Schnoering, H., Vazirgiannis, M. Bitcoin research with a transaction graph dataset. Sci Data 12, 404 (2025). https://doi.org/10.1038/s41597-025-04684-8
Received:
Accepted:
Published:
DOI: https://doi.org/10.1038/s41597-025-04684-8
