- Cardano’s price was rejected by its ascending trendline pullback, suggesting a decline ahead.
- Artemis data shows decreasing daily trading volume, suggesting a fall in traders’ interest and liquidity in the ADA chain.
- A daily candlestick close above $0.367 would invalidate the bearish thesis.
Cardano (ADA) is trading slightly down around $0.33 on Monday, struggling against resistance from its previously broken ascending trendline. Declining daily trading volume reinforces a bearish outlook, indicating reduced trader interest and liquidity in the ADA chain.
Cardano shows signs of weakness
Cardano price broke and closed below the ascending trendline (drawn by joining multiple low levels since August ) on Friday, after rejection and declining 9.2% from the 50% price retracement level at $0.367 since Wednesday. It recovered slightly to retest the broken trendline and was rejected. On Monday, it declines slightly, trading around $0.332, facing resistance from the broken trendline at around $0.342.
If the $0.342 holds as resistance, ADA could decline over 9% to retest its September 6 low of $0.303.
The Relative Strength Index (RSI) indicator on the daily chart reads 42, below its neutral level of 50, indicating increasing bearish momentum.
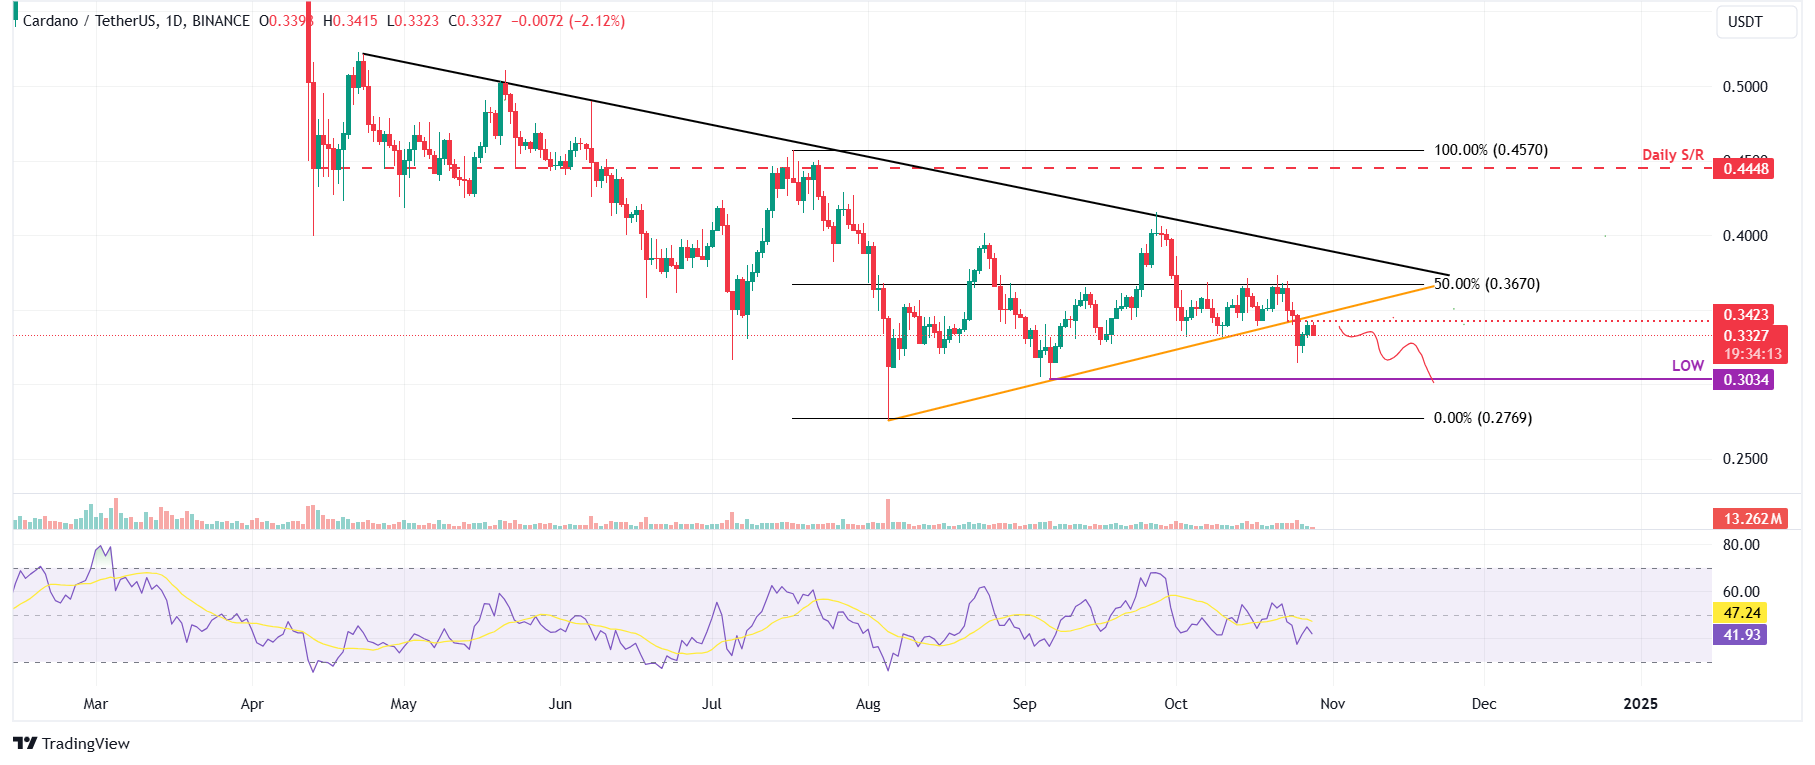
ADA/USDT daily chart
Based on IntoTheBlock’s In/Out of the Money Around Price (IOMAP), nearly 119,360 addresses accumulated 2.27 billion ADA tokens at an average price of $0.336. These addresses bought the tokens previously for between $0.332 and $0.341 and would likely sell them to get out at a breakeven price, which makes it a key resistance zone.
Interestingly, the zone mentioned from a technical analysis perspective, the $0.341 level, coincides with the IOMAP findings, making this zone a key reversal area to watch.
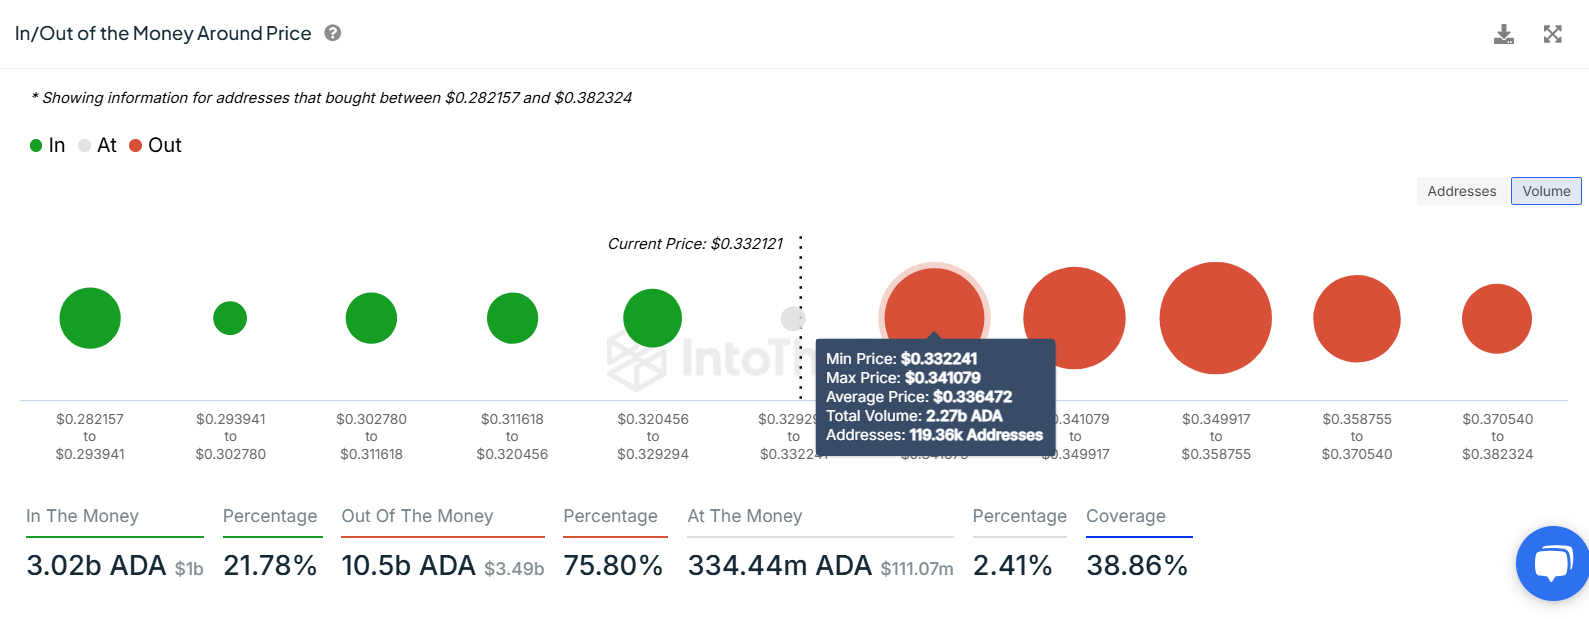
Cardano IOMAP chart. Source: IntoTheBlock
Another aspect bolstering the platform’s bearish outlook is a fall in traders’ interest and liquidity in the ADA chain. Artemis Terminal data shows that ADA’s daily trading volume fell from $545 million on Friday to $197 million on Sunday, the lowest level since early October and has been constantly declining since mid-February.
-638656921108702879.jpg)
ADA daily trading volume chart. Source: Artemis Terminal
However, the bearish thesis would be invalidated if ADA breaks and closes above the $0.367. This scenario could result in a rise in Cardano’s price to retest its September 27 high of $0.415.
Information on these pages contains forward-looking statements that involve risks and uncertainties. Markets and instruments profiled on this page are for informational purposes only and should not in any way come across as a recommendation to buy or sell in these assets. You should do your own thorough research before making any investment decisions. FXStreet does not in any way guarantee that this information is free from mistakes, errors, or material misstatements. It also does not guarantee that this information is of a timely nature. Investing in Open Markets involves a great deal of risk, including the loss of all or a portion of your investment, as well as emotional distress. All risks, losses and costs associated with investing, including total loss of principal, are your responsibility. The views and opinions expressed in this article are those of the authors and do not necessarily reflect the official policy or position of FXStreet nor its advertisers. The author will not be held responsible for information that is found at the end of links posted on this page.
If not otherwise explicitly mentioned in the body of the article, at the time of writing, the author has no position in any stock mentioned in this article and no business relationship with any company mentioned. The author has not received compensation for writing this article, other than from FXStreet.
FXStreet and the author do not provide personalized recommendations. The author makes no representations as to the accuracy, completeness, or suitability of this information. FXStreet and the author will not be liable for any errors, omissions or any losses, injuries or damages arising from this information and its display or use. Errors and omissions excepted.
The author and FXStreet are not registered investment advisors and nothing in this article is intended to be investment advice.
Recommended Content
Editors’ Picks

Pi Network rally halts under $0.80 as traders speculate about upcoming ecosystem announcement
Pi Network’s recent price action sends multiple buy signals, but resistance under $0.80 appears to be capping the uptrend. The Pi Network team teases a major announcement on May 14, fueling speculation and trader interest on the coin.

Bitcoin Weekly Forecast: BTC bulls aim for $105,000 after nearly 10% weekly gains
Bitcoin price stabilizes around $103,000 on Friday after rallying nearly 10% this week. Risk-on sentiment prevails as Trump announced a trade deal with the UK and ahead of the meeting with China this weekend.

Dogecoin price jump above $0.20 triggers $13 million in liquidations
Dogecoin price edges higher after stepping above $0.20 and climbing to trade around $0.21 at the time of writing on Friday. The leading meme coin's uptrend mirrors a broad-based bullish wave in the market, triggered by the trade agreement between the US and the UK on Thursday.

XRP price could hit $3 on $50M SEC settlement
Ripple and the SEC strike a $50 million settlement agreement pending judicial approval. A joint motion in the US District Court aims to lift Ripple’s injunction and release $125M in escrowed penalties.
Bitcoin: BTC bulls aim for $105,000 after nearly 10% weekly gains
Bitcoin (BTC) price is stabilizing around $103,000 at the time of writing on Friday after rallying nearly 10% this week.

The Best brokers to trade EUR/USD
SPONSORED Discover the top brokers for trading EUR/USD in 2025. Our list features brokers with competitive spreads, fast execution, and powerful platforms. Whether you're a beginner or an expert, find the right partner to navigate the dynamic Forex market.