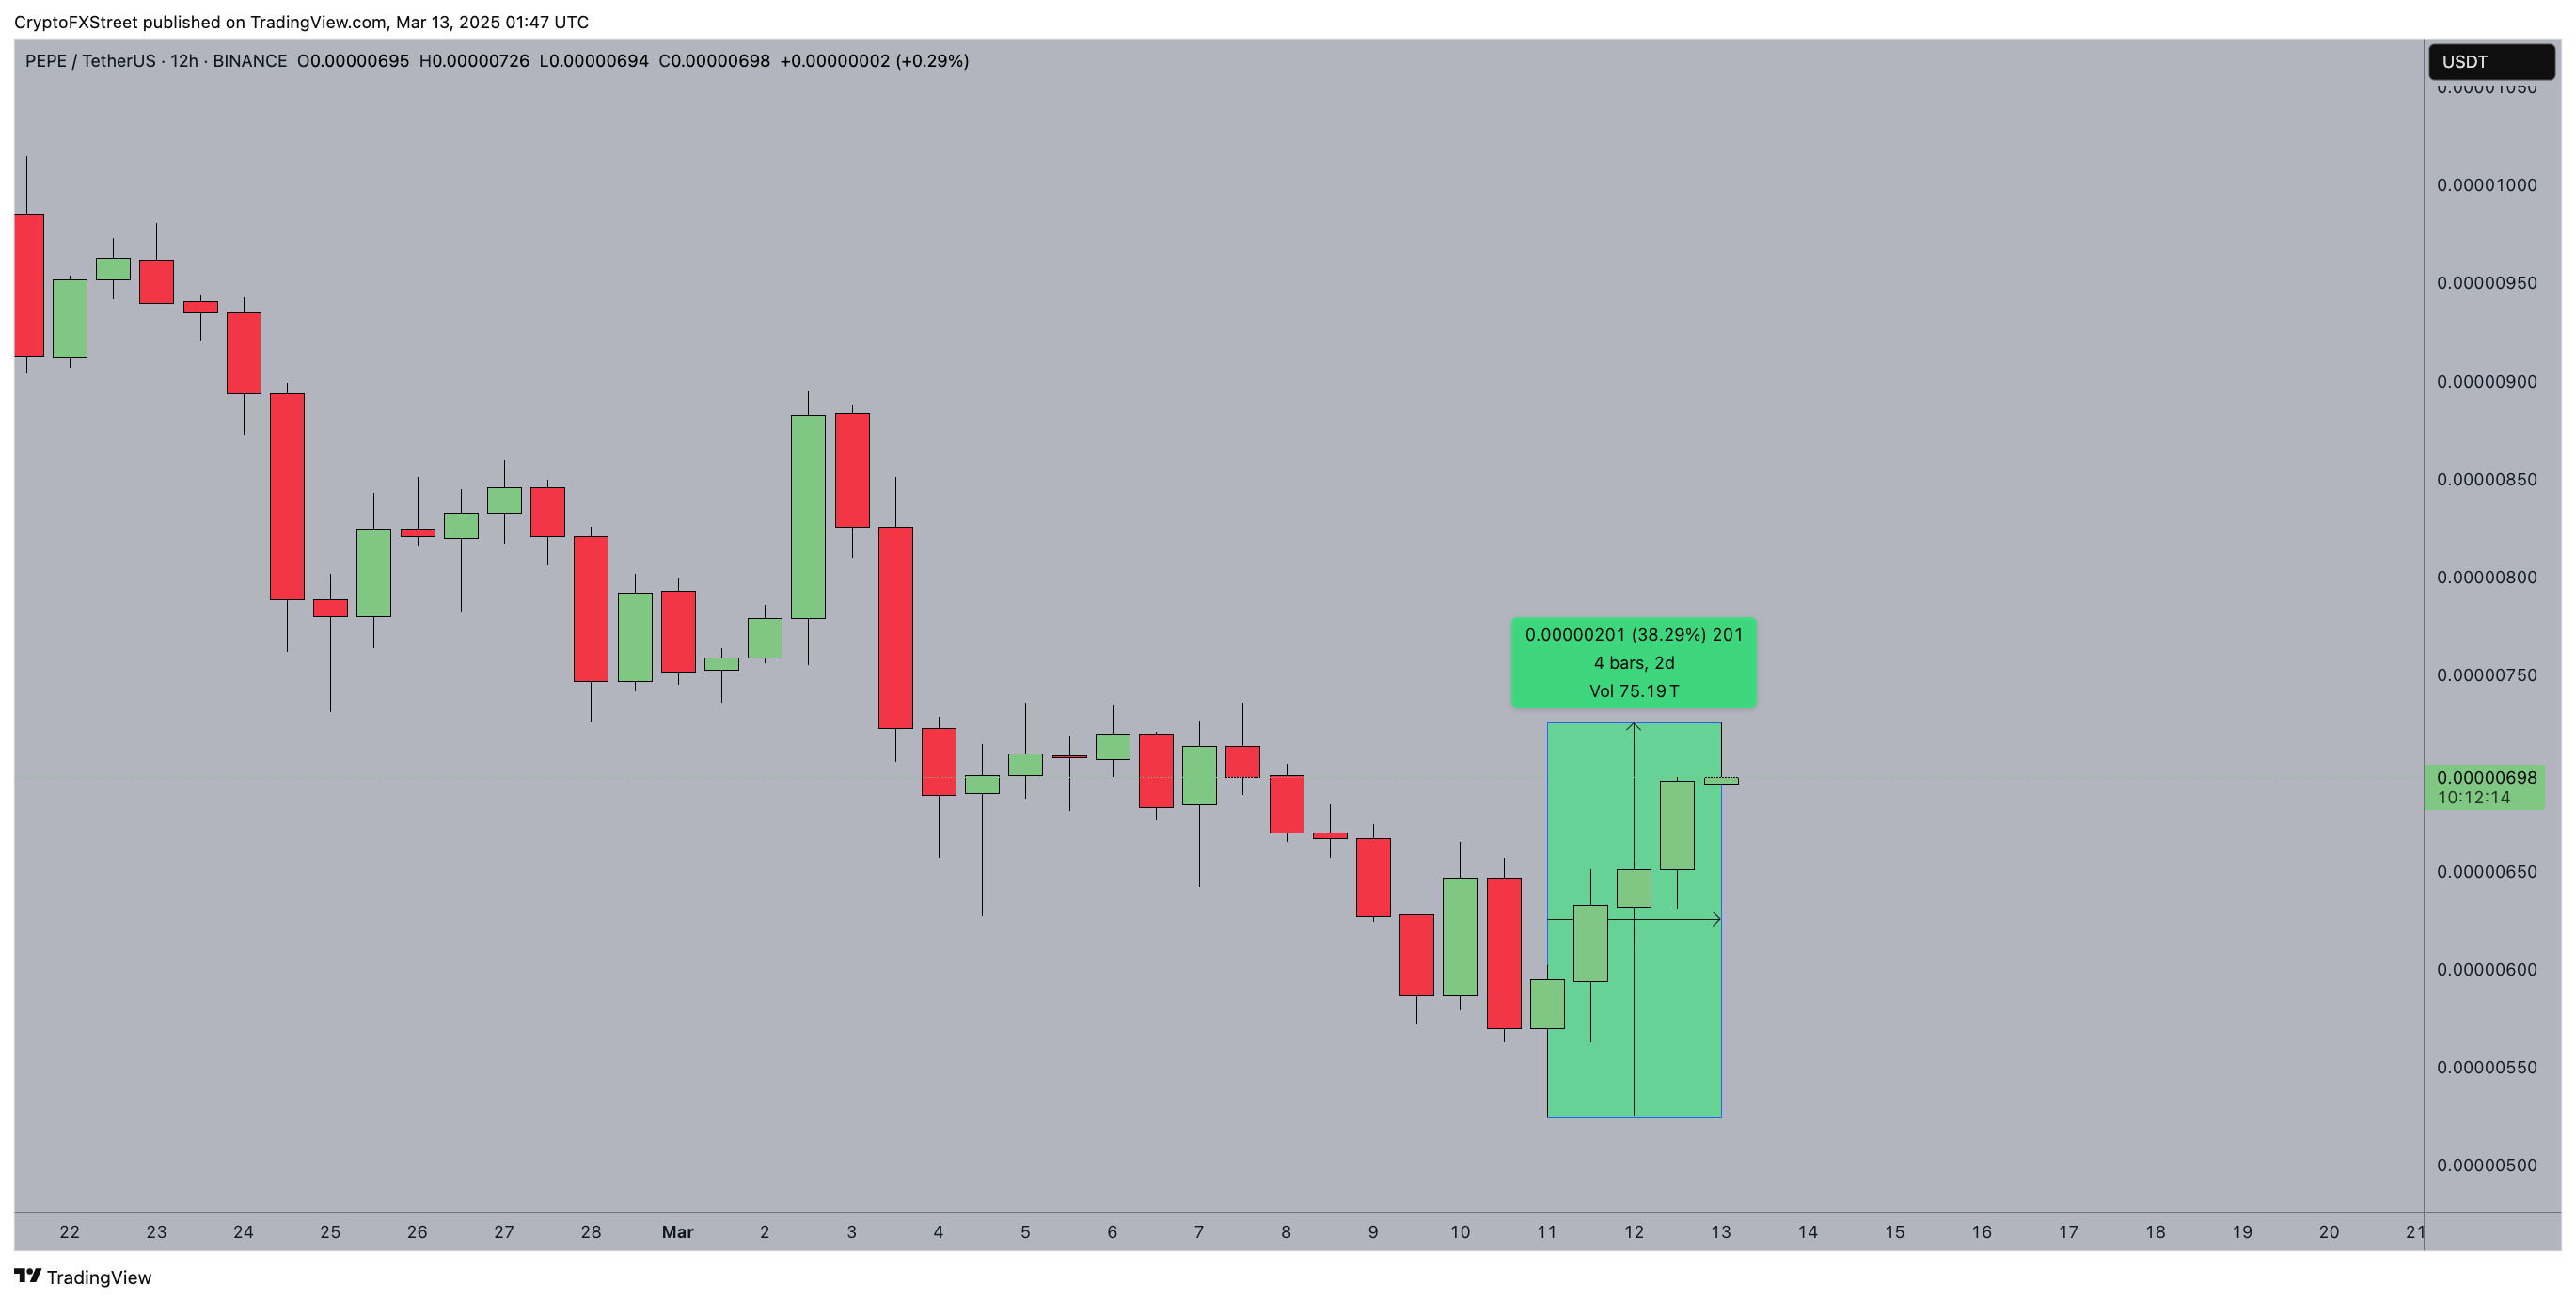
- Pepe price hit $0.00007 on Wednesday, up 33% from the year-to-date lows of $0.00005 recorded on Tuesday.
- Crypto traders leaned into top 3 memecoins as the market recovered on positive US CPI readings.
- Technical indicators on the PEPEUSD 12-hourly chart show that short-term momentum remains bullish.
PEPE price crossed the $0.00007 for the first time this week as markets reacted to positive macro market signals. Early insights show crypto traders are displaying high risk appetite at the onset of the current market rally. Could this sustain PEPE price uptrend along with the rest of the memecoin market.
PEPE skips ahead of DOGE and SHIB as US inflation tips off bulls recovery
PEPE led the memecoin sector's recovery on Wednesday, outperforming Dogecoin (DOGE) and Shiba Inu (SHIB) as broader crypto markets rebounded.
The rally was driven by renewed risk appetite and fresh capital inflows.
PEPE price analysis
As of Thursday, PEPE price rose as high as $0,000007, its highest since March 3, when market rallied in reaction to Trump’s crypto strategic reserve announcement,
According to CoinGecko data, memecoins saw a surge in inflows, with their total market capitalization climbing 7.4% to nearly $50 billion.
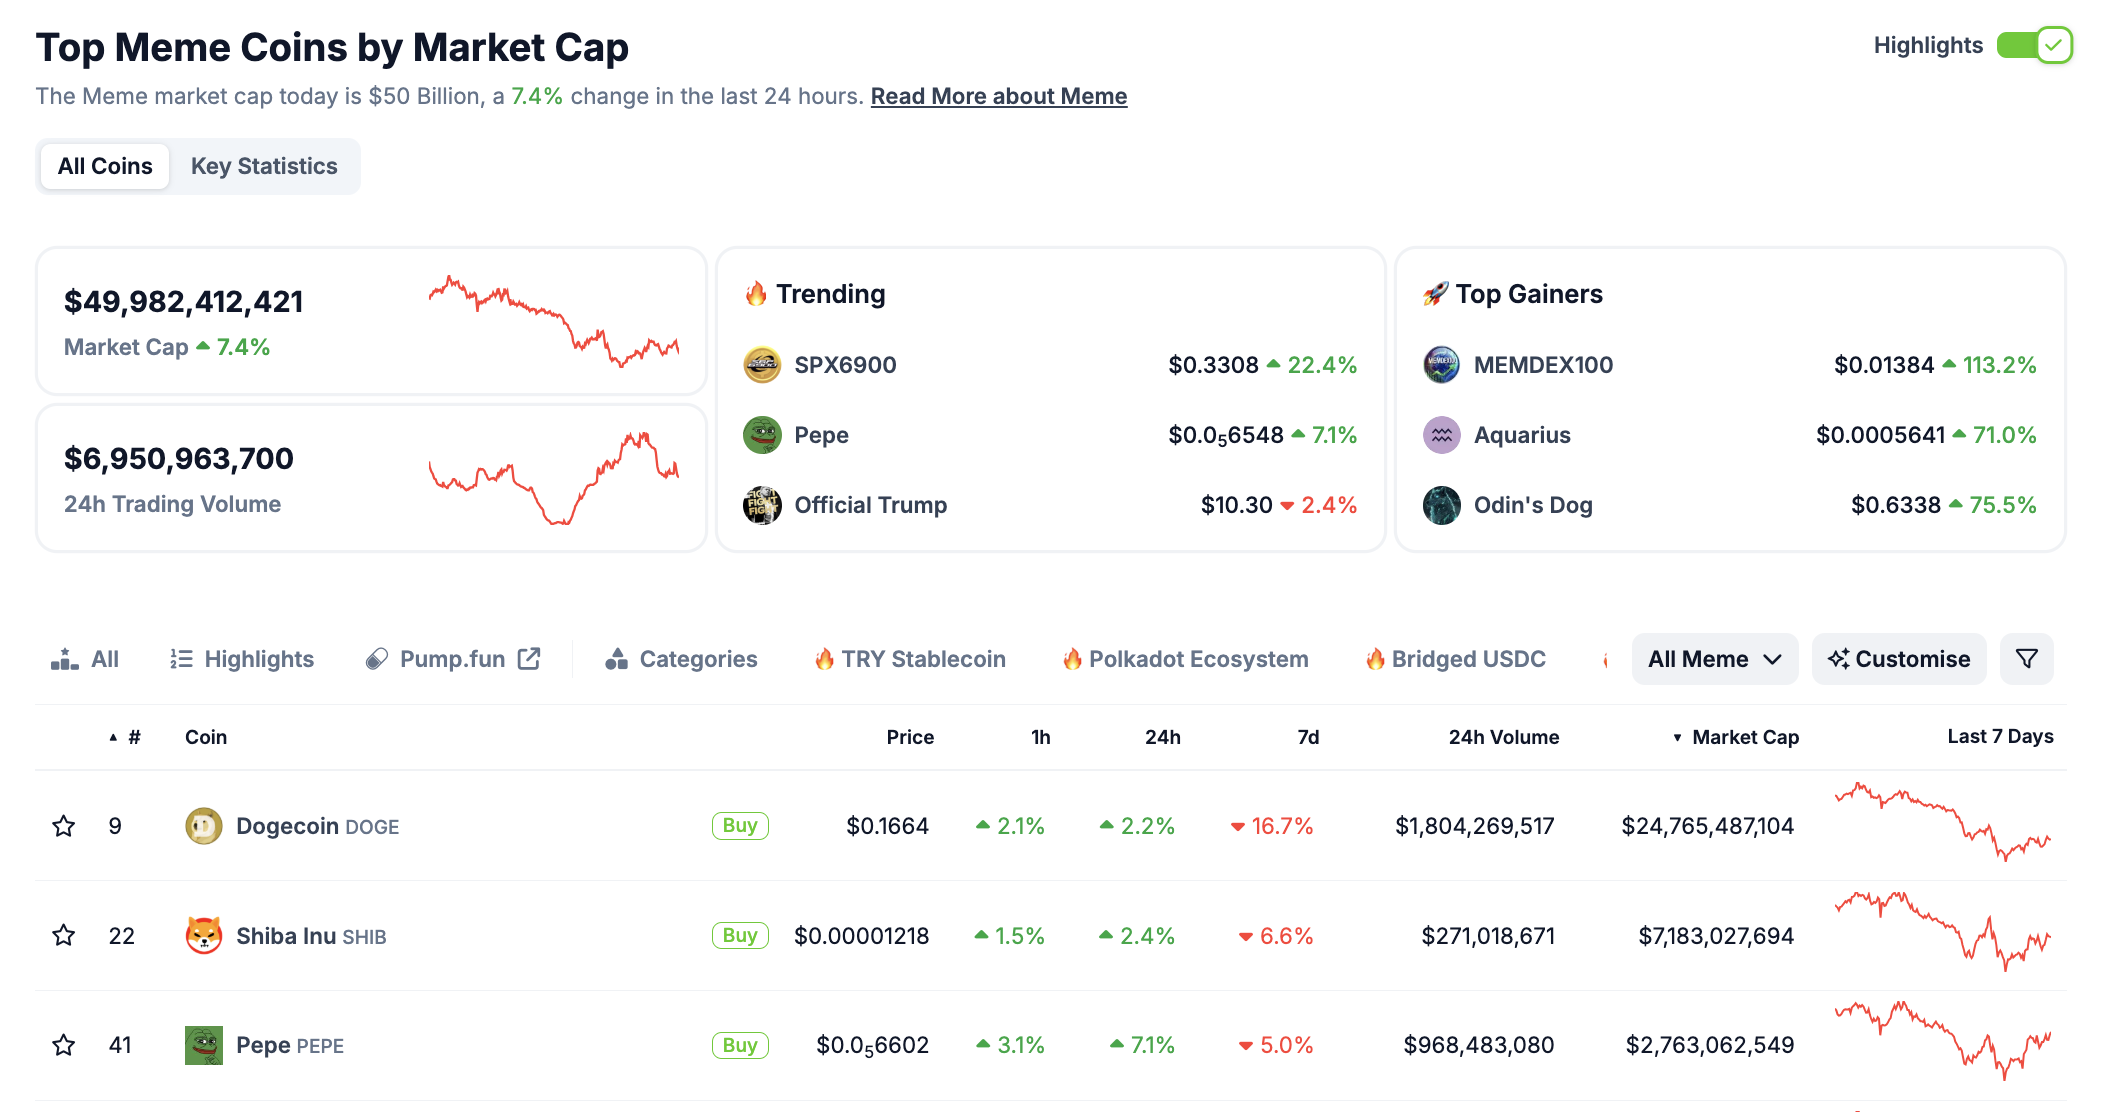
Memecoin market performance, March 12 | Source: Coingecko
Among the top-ranked tokens, PEPE stood out, establishing an early lead with 7% gains at the onset of the rally on Wednesday,
In comparison, DOGE added 2.2%, while SHIB rose 2.4% over the past 24 hours.
Historically, when memecoins outperform the broader market, it signals increased speculative interest, as these assets tend to be highly sensitive to shifts in sentiment and liquidity.
PEPE price forecast: Bulls eye $0.00000800 breakout, but resistance threatens reversal
PEPE price is leaning bullish following a 38% surge over four days, yet resistance at $0.00000760 remains a key hurdle.
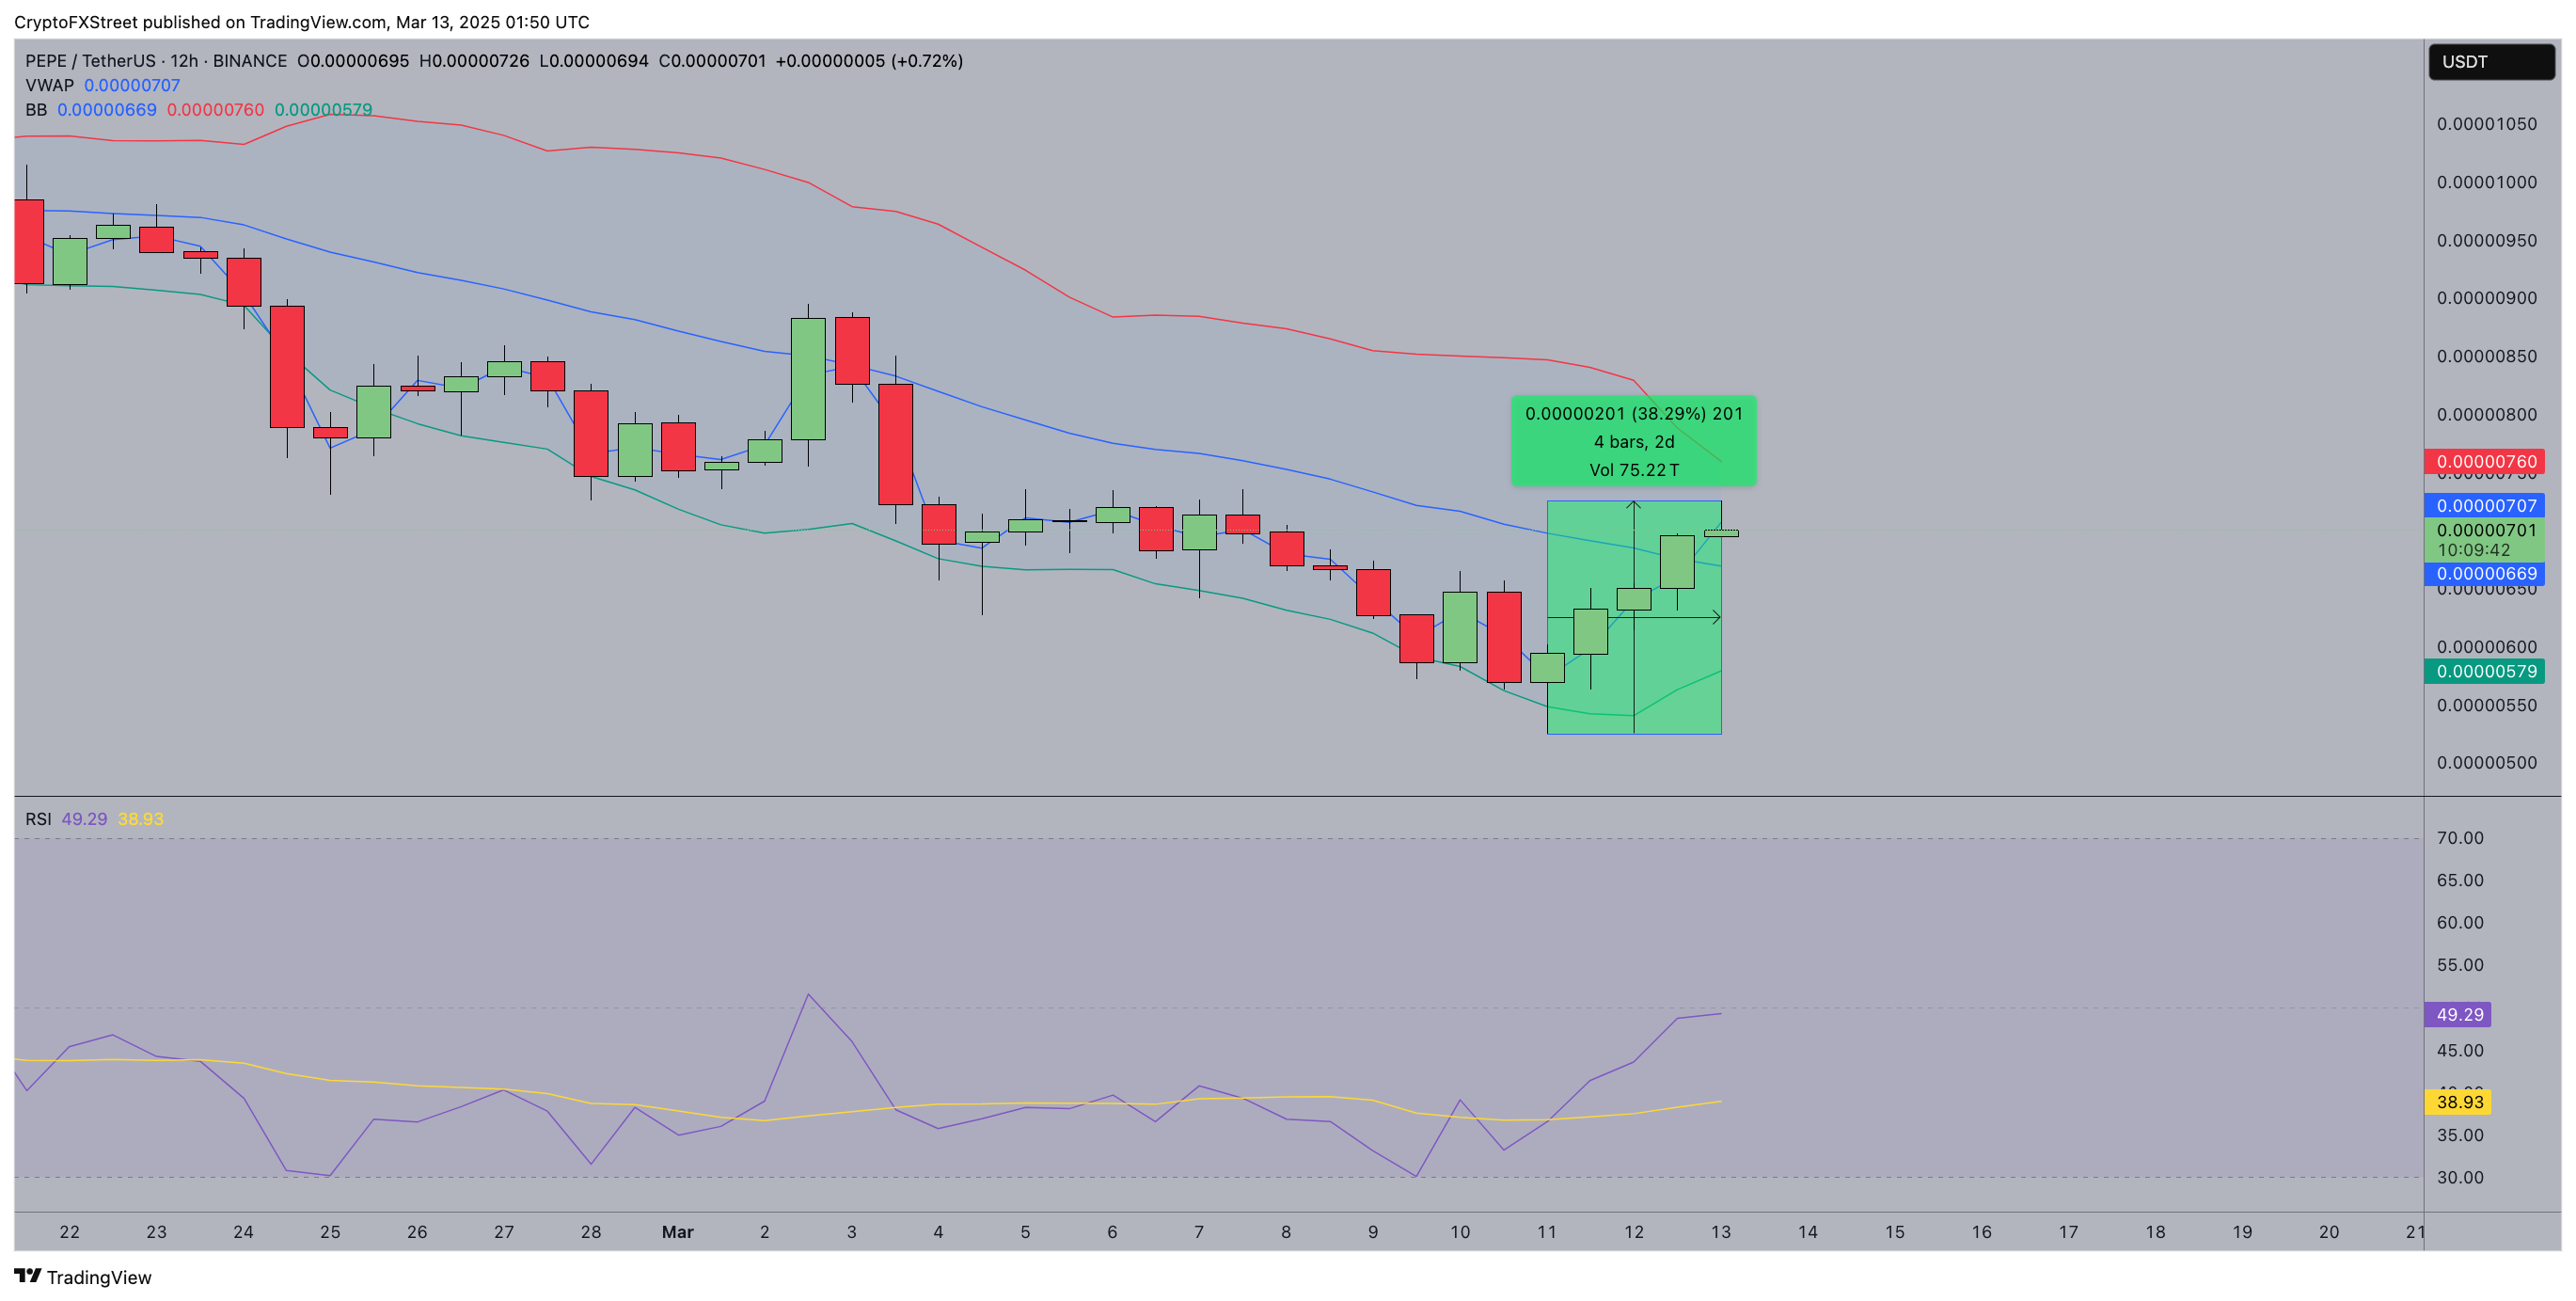
The 12-hour Bollinger Bands show widening volatility, with price testing the midline at $0.00000707.
A sustained hold above this level could allow bulls to challenge the upper Bollinger Band at $0.00000760, setting up a potential breakout toward $0.00000800.
However, failure to close above resistance may invite selling pressure, with the lower band at $0.00000579 as a downside target.
PEPE price forecast
The Relative Strength Index (RSI) at 49.29 signals indecision, hovering near neutral territory.
A move above 55 would confirm bullish strength, while a dip below 38.93 could trigger a reversal.
Meanwhile, the Volume-Weighted Average Price (VWAP) at $0.00000707 suggests that the market remains fairly priced, but any rejection here could indicate overleveraged long positions unwinding.
If bulls lose control, a retracement toward $0.00000669 becomes likely.
For sustained upside, PEPE must clear $0.00000760 with rising volume to confirm momentum.
However, excessive leverage could introduce sharp liquidations, leading to heightened volatility.
Bulls remain in control for now, but failure to hold key support levels above $0.000006 could see bears regain dominance.
Information on these pages contains forward-looking statements that involve risks and uncertainties. Markets and instruments profiled on this page are for informational purposes only and should not in any way come across as a recommendation to buy or sell in these assets. You should do your own thorough research before making any investment decisions. FXStreet does not in any way guarantee that this information is free from mistakes, errors, or material misstatements. It also does not guarantee that this information is of a timely nature. Investing in Open Markets involves a great deal of risk, including the loss of all or a portion of your investment, as well as emotional distress. All risks, losses and costs associated with investing, including total loss of principal, are your responsibility. The views and opinions expressed in this article are those of the authors and do not necessarily reflect the official policy or position of FXStreet nor its advertisers. The author will not be held responsible for information that is found at the end of links posted on this page.
If not otherwise explicitly mentioned in the body of the article, at the time of writing, the author has no position in any stock mentioned in this article and no business relationship with any company mentioned. The author has not received compensation for writing this article, other than from FXStreet.
FXStreet and the author do not provide personalized recommendations. The author makes no representations as to the accuracy, completeness, or suitability of this information. FXStreet and the author will not be liable for any errors, omissions or any losses, injuries or damages arising from this information and its display or use. Errors and omissions excepted.
The author and FXStreet are not registered investment advisors and nothing in this article is intended to be investment advice.
Recommended Content
Editors’ Picks

Ethereum set a new year-to-date high, next target above $4,000
Ethereum price is rebounding above $3,800 at the time of writing on Tuesday after setting a new year-to-date high at $3,941 the previous day. Institutional demand for ETH remained robust, with the ETH ETFs adding a further 1.6 million ETH in the past six weeks.
Pi Network holds to a crucial support as an unknown wallet adds 1.40M PI tokens
Pi Network edges lower by 0.61% at press time on Tuesday following the bullish failure to hold at higher levels on Monday. Amid the pullback to its weekly support of $0.43, an unknown wallet address has acquired 1.40 million PI tokens, advancing its week-long buying spree.

Ethena Price Forecast: ENA's 15% drop mirrors funding rates and open interest slump
Ethena (ENA) price remains suppressed for two consecutive days, trading at $0.60 at the time of writing on Tuesday. The synthetic dollar protocol built on Ethereum (ETH) has extended the decline 15% below its recent peak of $0.70.

Crypto Today: Bitcoin, Ethereum, XRP on cusp of another breakout
Bitcoin consolidates between $118,000 and $120,000, bolstered by steady institutional demand. The Ethereum bullish case targets a breakout above $4,000, despite the RSI remaining overbought. XRP holds above the critical $3.00 level, but downside risks remain amid a decline in futures Open Interest.

Bitcoin: BTC extends correction amid weakening momentum, ETFs outflow
Bitcoin (BTC) is slipping below the lower consolidation band at $116,000, after consolidating for more than ten days. A decisive close below this level would indicate further decline ahead.

The Best brokers to trade EUR/USD
SPONSORED Discover the top brokers for trading EUR/USD in 2025. Our list features brokers with competitive spreads, fast execution, and powerful platforms. Whether you're a beginner or an expert, find the right partner to navigate the dynamic Forex market.