- Dogecoin price retests its key support level at $0.22, with recovery on the cards.
- Shiba Inu price rebounds after finding support around its 50-day EMA, hinting at a short-term recovery.
- Pepe momentum indicators display bearish divergences, indicating a potential trend reversal.
Dogecoin (DOGE) and Shiba Inu (SHIB) prices are finding support around their key levels on Thursday, eyeing a short-term recovery. Meanwhile, Pepe (PEPE) displays a bearish divergence on the momentum indicators, indicating a potential trend reversal.
Dogecoin could recover if its 200-day EMA remains strong
Dogecoin price retested and stabilized around its 200-day Exponential Moving Average (EMA) at $0.21 multiple times this week. The 200-day EMA roughly coincides with the daily support level at $0.22, making this a key area of support. At the time of writing on Thursday, it rebounds slightly after retesting this support level.
Sideline investors looking for buy opportunities could do so at its 200-day EMA at $0.21.
If the 200-day EMA remains strong, DOGE could extend the recovery by 17% from its current level to retest its upper trendline boundary at around $0.26.
The Relative Strength Index (RSI) on the daily chart reads 55, rebounding from its neutral level of 50 and pointing upward, indicating bullish momentum is gaining some traction.
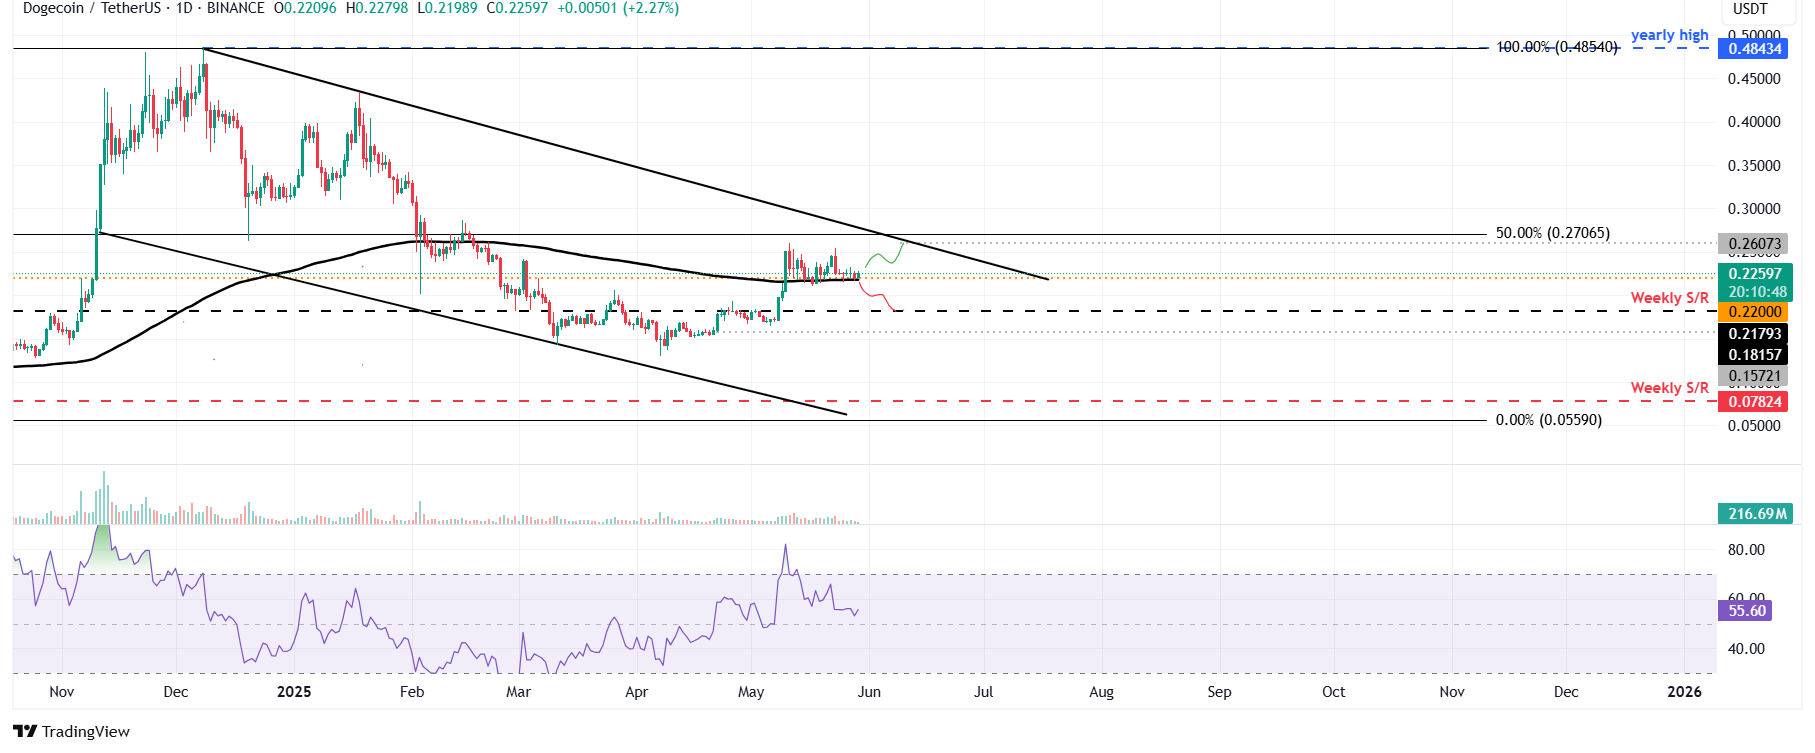
DOGE/USDT daily chart
However, if Doge breaks and closes below its 200-day EMA at $0.21, it could extend the decline to retest its next weekly support at $0.18.
Shiba Inu consolidates around key level, a recovery is on the cards
Shiba Inu price retested and found support around its 50-day EMA at $0.0000141 on Saturday and has been consolidating around this level. The 50-day EMA coincides with the daily support and the previously broken descending trendline, making this an important support level. At the time of writing on Thursday, it recovers slightly after retesting the 50-day EMA.
Sideline investors looking for short-term buy opportunities could do so at its current level of $0.0000145.
If the 50-day EMA continues to hold as support, SHIB could extend its recovery by 14% from its current level, potentially retesting its May 14 high of $0.0000167.
The RSI on the daily chart reads 51 and points upward after flattening around its neutral level of 50, indicating bullish momentum is gaining traction.
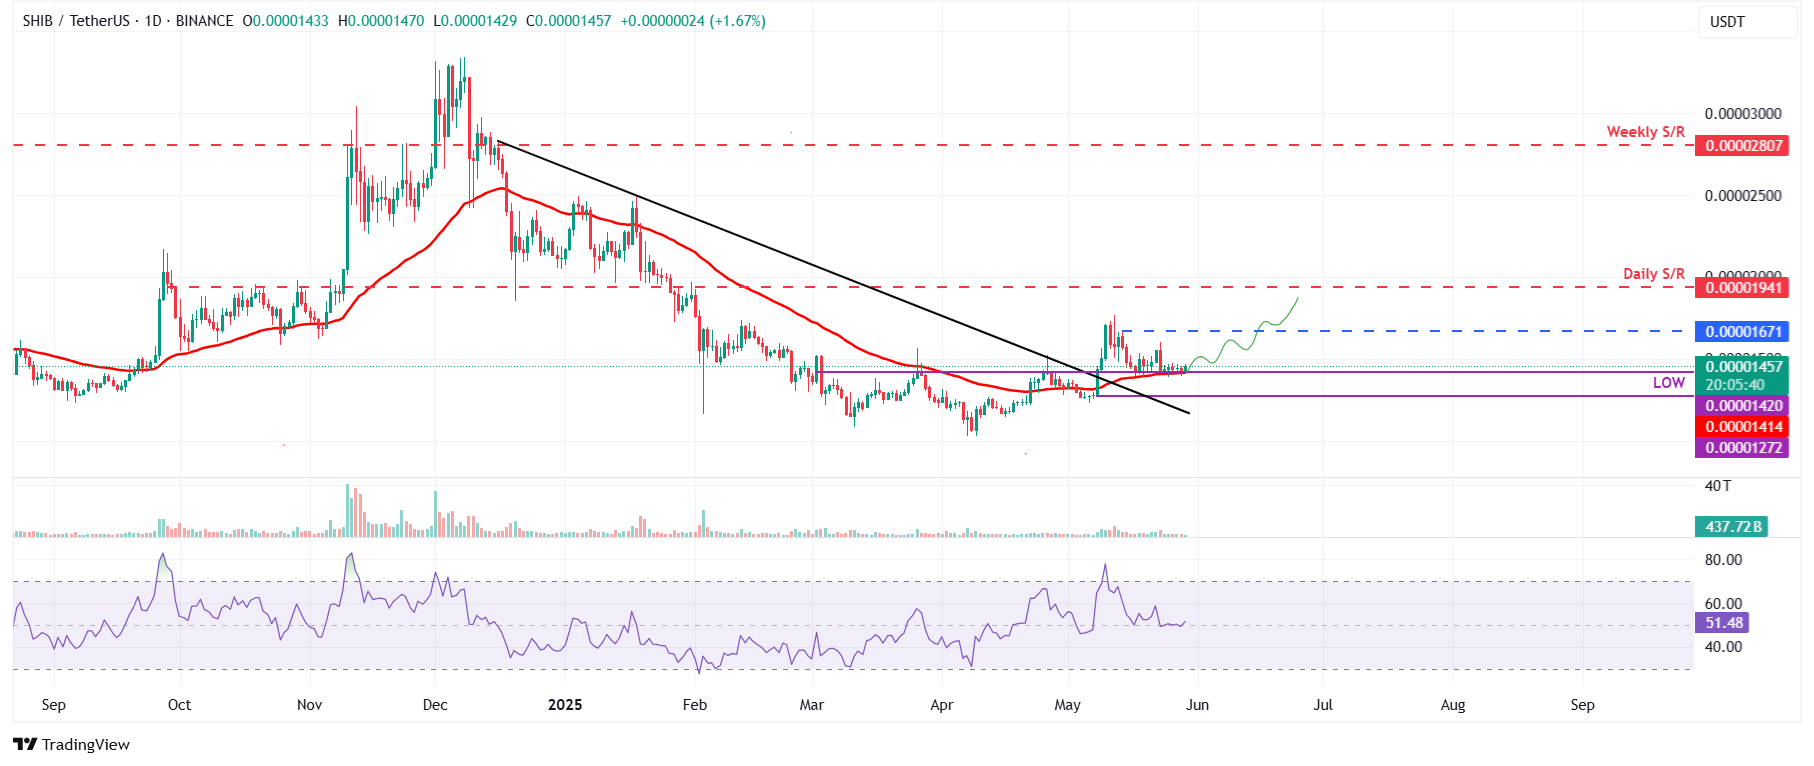
SHIB/USDT daily chart
On the other hand, if SHIB closes below the $0.0000141 support level, it could extend the decline to revisit its low of $0.0000127.
Pepe shows weakness in momentum indicators
Pepe price faced rejection around its daily level at $0.000016 last week and declined by 12.19% until Sunday. It recovered slightly at the start of the week. However, PEPE consolidated around the $0.0000136 level for the next three days. At the time of writing on Thursday, it recovers slightly, trading around $0.0000146.
The Relative Strength Index (RSI) indicator reflects weakness in momentum on the daily chart. The higher high in the frog-theme meme coin, which formed on May 23, does not align with the RSI's lower high for the same period. This development is referred to as a bearish divergence, which often signals a trend reversal or a short-term pullback. Moreover, the Moving Average Convergence Divergence (MACD) indicator also displayed a bearish crossover, indicating a potential sell signal and a correction ahead.
Sideline investors looking for sell opportunities could do so at its current level of $0.0000146.
If Pepe faces a correction, it could extend the decline to retest its next daily support at $0.0000121. Any follow-through selling below this level could trigger a drop to $0.0000107, its 100-day exponential moving average (EMA).
The bearish outlook for the Pepe meme coin remains in place, as the price is currently below the key daily resistance level at $0.000016 on the daily chart. A close above this level would invalidate the bearish thesis.
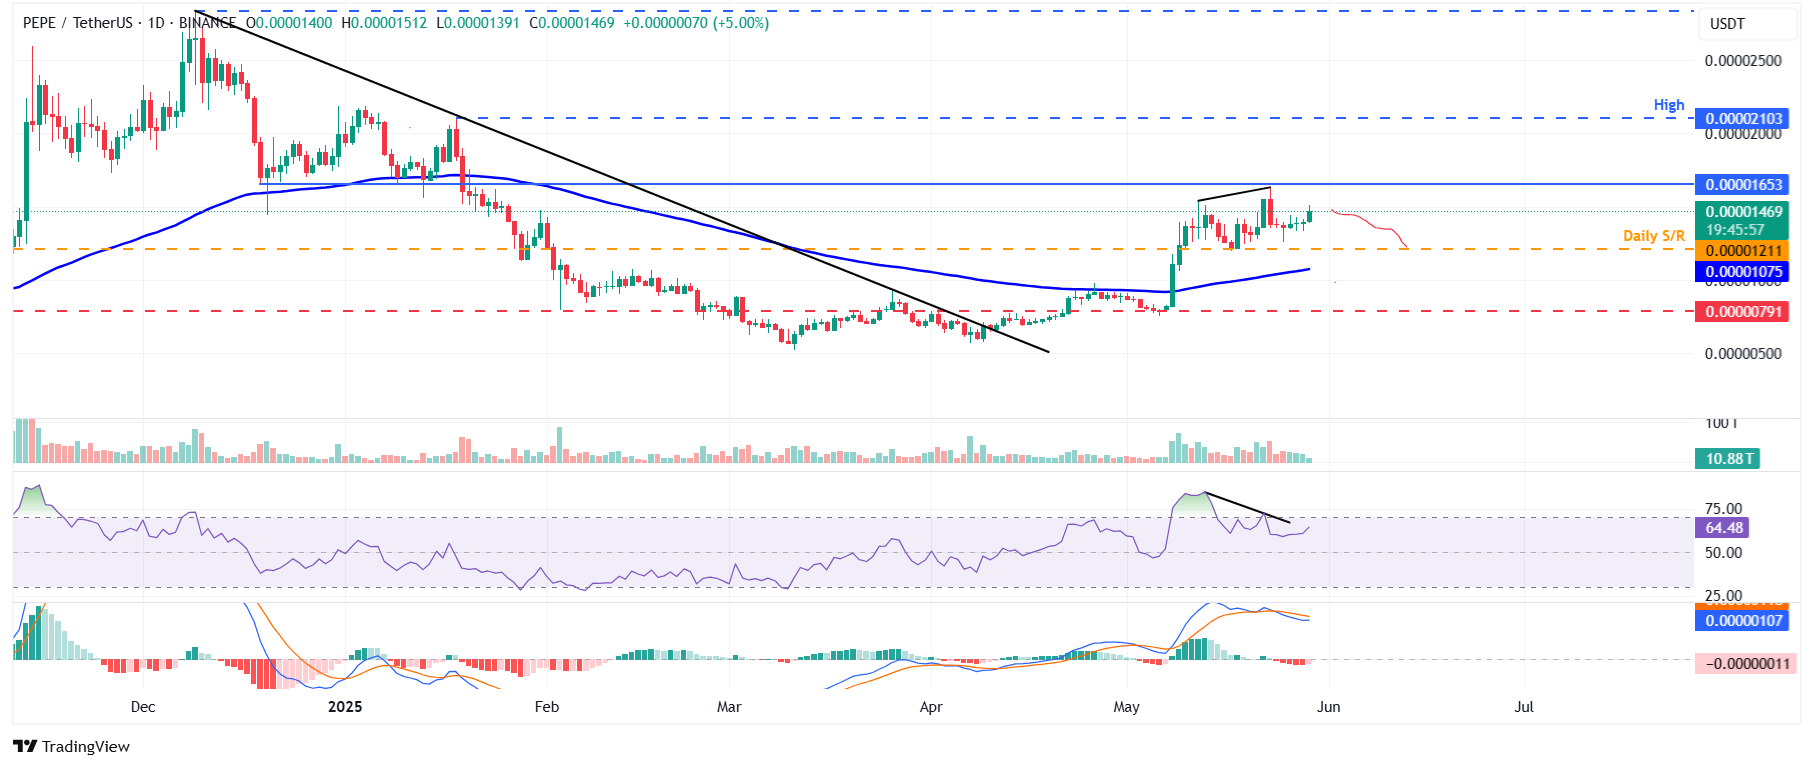
PEPE/USDT daily chart
Information on these pages contains forward-looking statements that involve risks and uncertainties. Markets and instruments profiled on this page are for informational purposes only and should not in any way come across as a recommendation to buy or sell in these assets. You should do your own thorough research before making any investment decisions. FXStreet does not in any way guarantee that this information is free from mistakes, errors, or material misstatements. It also does not guarantee that this information is of a timely nature. Investing in Open Markets involves a great deal of risk, including the loss of all or a portion of your investment, as well as emotional distress. All risks, losses and costs associated with investing, including total loss of principal, are your responsibility. The views and opinions expressed in this article are those of the authors and do not necessarily reflect the official policy or position of FXStreet nor its advertisers. The author will not be held responsible for information that is found at the end of links posted on this page.
If not otherwise explicitly mentioned in the body of the article, at the time of writing, the author has no position in any stock mentioned in this article and no business relationship with any company mentioned. The author has not received compensation for writing this article, other than from FXStreet.
FXStreet and the author do not provide personalized recommendations. The author makes no representations as to the accuracy, completeness, or suitability of this information. FXStreet and the author will not be liable for any errors, omissions or any losses, injuries or damages arising from this information and its display or use. Errors and omissions excepted.
The author and FXStreet are not registered investment advisors and nothing in this article is intended to be investment advice.
Recommended Content
Editors’ Picks

BNB down 5% from peak as Windtree Therapeutics plans $520 million treasury
BNB price is down slightly to trade at $771 on Friday, after correcting from its new record high of $809, reached on Wednesday. The Binance exchange native token is up nearly 20% in July, amid relatively overheated market conditions and institutional adoption.

Crypto Today: Bitcoin declines amid de-risking sentiment, Ethereum and XRP hold key support
Bitcoin sweeps through liquidity around $115,000 level, amid profit-taking and risk-off sentiment. Ethereum rebounds from range low support above $3,500 amid steady ETF inflow.

Ethena eyes 20% gains amid Arthur Hayes 2 million ENA grab, Anchorage Digital deal, new apps
Ethena edges higher by over 20% on Friday as it bounces off a crucial support floor to extend the prevailing bullish run. Arthur Hayes acquires 2.16 million ENA tokens amid Ethena’s partnership with Anchorage Digital to achieve GENIUS Act compliance.

Bitcoin Weekly Forecast: BTC extends correction amid weakening momentum, ETFs outflow
Bitcoin price is slipping below the lower consolidation band at $116,000, a decisive close below to indicate further decline ahead. US-listed spot Bitcoin ETFs show early signs of investor pullback, recording a mild weekly outflow of $58.64 million by Thursday.
Bitcoin: BTC extends correction amid weakening momentum, ETFs outflow
Bitcoin (BTC) is slipping below the lower consolidation band at $116,000, after consolidating for more than ten days. A decisive close below this level would indicate further decline ahead.

The Best brokers to trade EUR/USD
SPONSORED Discover the top brokers for trading EUR/USD in 2025. Our list features brokers with competitive spreads, fast execution, and powerful platforms. Whether you're a beginner or an expert, find the right partner to navigate the dynamic Forex market.