- Collateral token Amp registers the highest gains in the last 24 hours among the top 200 cryptos by market capitalization.
- Artificial Intelligence token Aethir holds steady despite the overbought RSI and resistance at $0.054.
- Helium struggles to hold onto gains, dropping to $4.00 as upside risks surge under the 200-day EMA resistance.
The cryptocurrency market is taking a breather on Thursday after sustaining gains for almost two weeks, buoyed by heightened risk-on sentiment amid easing trade tensions between the United States (US) and China. While most top currencies are either stable or losing ground, Ethereum ecosystem tokens Amp (AMP) and Aethir (ATH) have defied the broad-based drawdown, stealing the spotlight among the top 200 cryptocurrencies, to post the highest gains in the last 24 hours.
On the other hand, Helium (HNT), which also posted gains in the last 24 hours but is partly erasing them on Thursday, faces growing upside risks after rejection below the seller congestion at around $4.38.
Amp’s uptrend is steady above $0.005
Amp’s price edges higher on Thursday, increasing by more than 3% to trade at $0.0051. The digital collateral token, which offers instant, verifiable assurances for any value transfer, boasts over 16% growth in value in the last 24 hours, defying the pullback in the broader crypto market.
Amp’s price sits above key moving averages ranging from the 200-day Exponential Moving Average (EMA) at $0.0049, the 100-day EMA at $0.0045, to the 50-day EMA at $0.0042, signifying a strong bullish momentum and the token’s ability to sustain recovery in upcoming sessions.
A daily close above the 200-day EMA would encourage traders to keep their exposure to AMP, eyeing another leg up to $0.0065, a level tested last in January as support and in February as resistance.
Technical indicators support the bullish outlook, including the Moving Average Convergence Divergence (MACD), which currently sits above the center line, upholding a recently confirmed buy signal, and the overbought but uptrending Relative Strength Index (RSI) at 76.46.

AMP/USDT daily chart
Traders should brace for multiple scenarios despite AMP’s recent surge, as the RSI indicator’s overbought conditions signal a potential trend reversal. An increase in sell-side pressure due to potential profit-taking could halt momentum in the near term.
Tentative support levels lie at the 200-day EMA at $0.0049, the 100-day EMA at $0.0045 and the 50-day EMA at $0.0042.
Aethir’s bullish comeback is in progress
Enterprise-grade Artificial Intelligence (AI)-focused token Aethir’s rally seems unstoppable despite the market-wide cool-off. ATH is up over 4% on the day and 16% in the last 24 hours to exchange hands at $0.052.
The rally follows a break above an extended descending trendline, which had capped Aethir’s upside price action since December. Subsequent gains above the 50-day EMA, the 100-day EMA and the 200-day EMA ascertained the uptrend’s strength.
The MACD indicator shows that bullish momentum is still strong as it lifts higher above the centre line, but a decisive break above Aethir’s (ATH) immediate resistance at $0.054 could trigger outsized gains in the coming days.
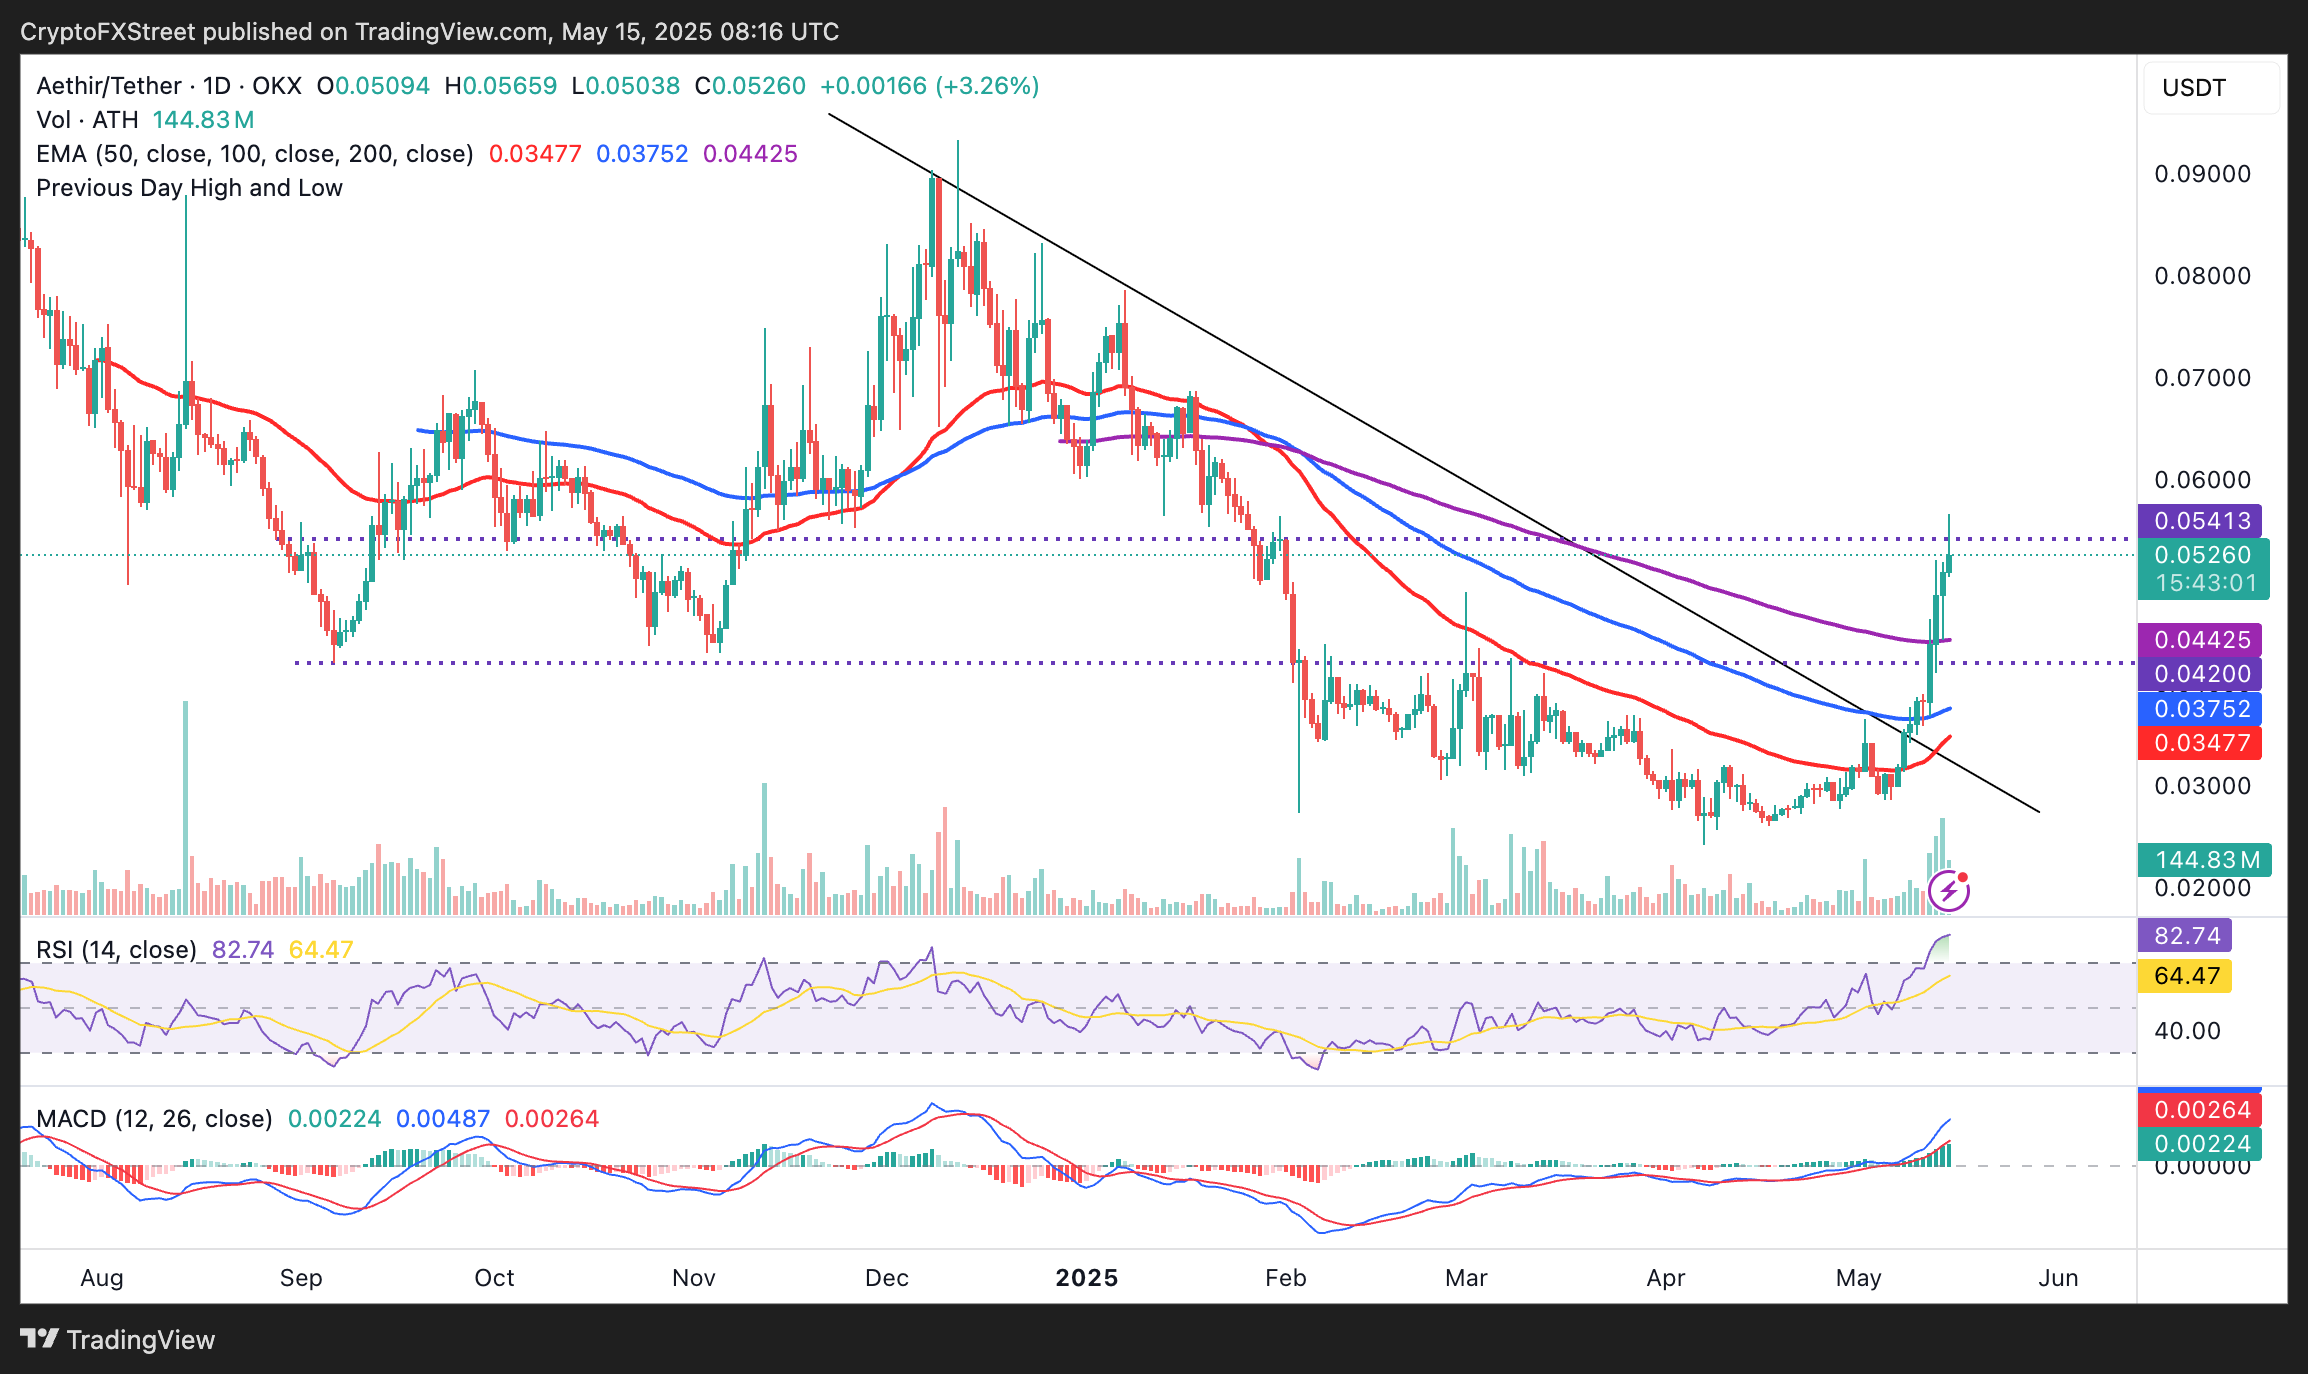
ATH/USDT daily chart
However, the RSI indicator overbought at 82.75, suggests that traders must be cautious. Overbought conditions are often a precursor to sudden sharp drawdowns, reflecting declining sentiment in the larger crypto market and potential selling for profit among traders.
Helium’s uptrend cracks below the 20-day EMA
Helium, the decentralised Internet of Things (IoT) token, enabling devices to communicate and share data, has encountered a massive resistance cluster slightly below the 200-day EMA at $4.38, resulting in a sharp drop in price to $4.00. Despite the recent pullback, HNT remains one of the best-performing crypto assets in the last 24 hours with a 3% price increase.
Before the pullback, HNT was on the cusp of validating a double-bottom pattern, projecting a 48.5% move above the breakout point ($4.43) to $6.58. If declines overshadow the 100-day EMA support at $3.83, it would be difficult to immediately resume the uptrend, possibly culminating in larger than anticipated losses to $3.00, a support area tested frequently over the last three months.
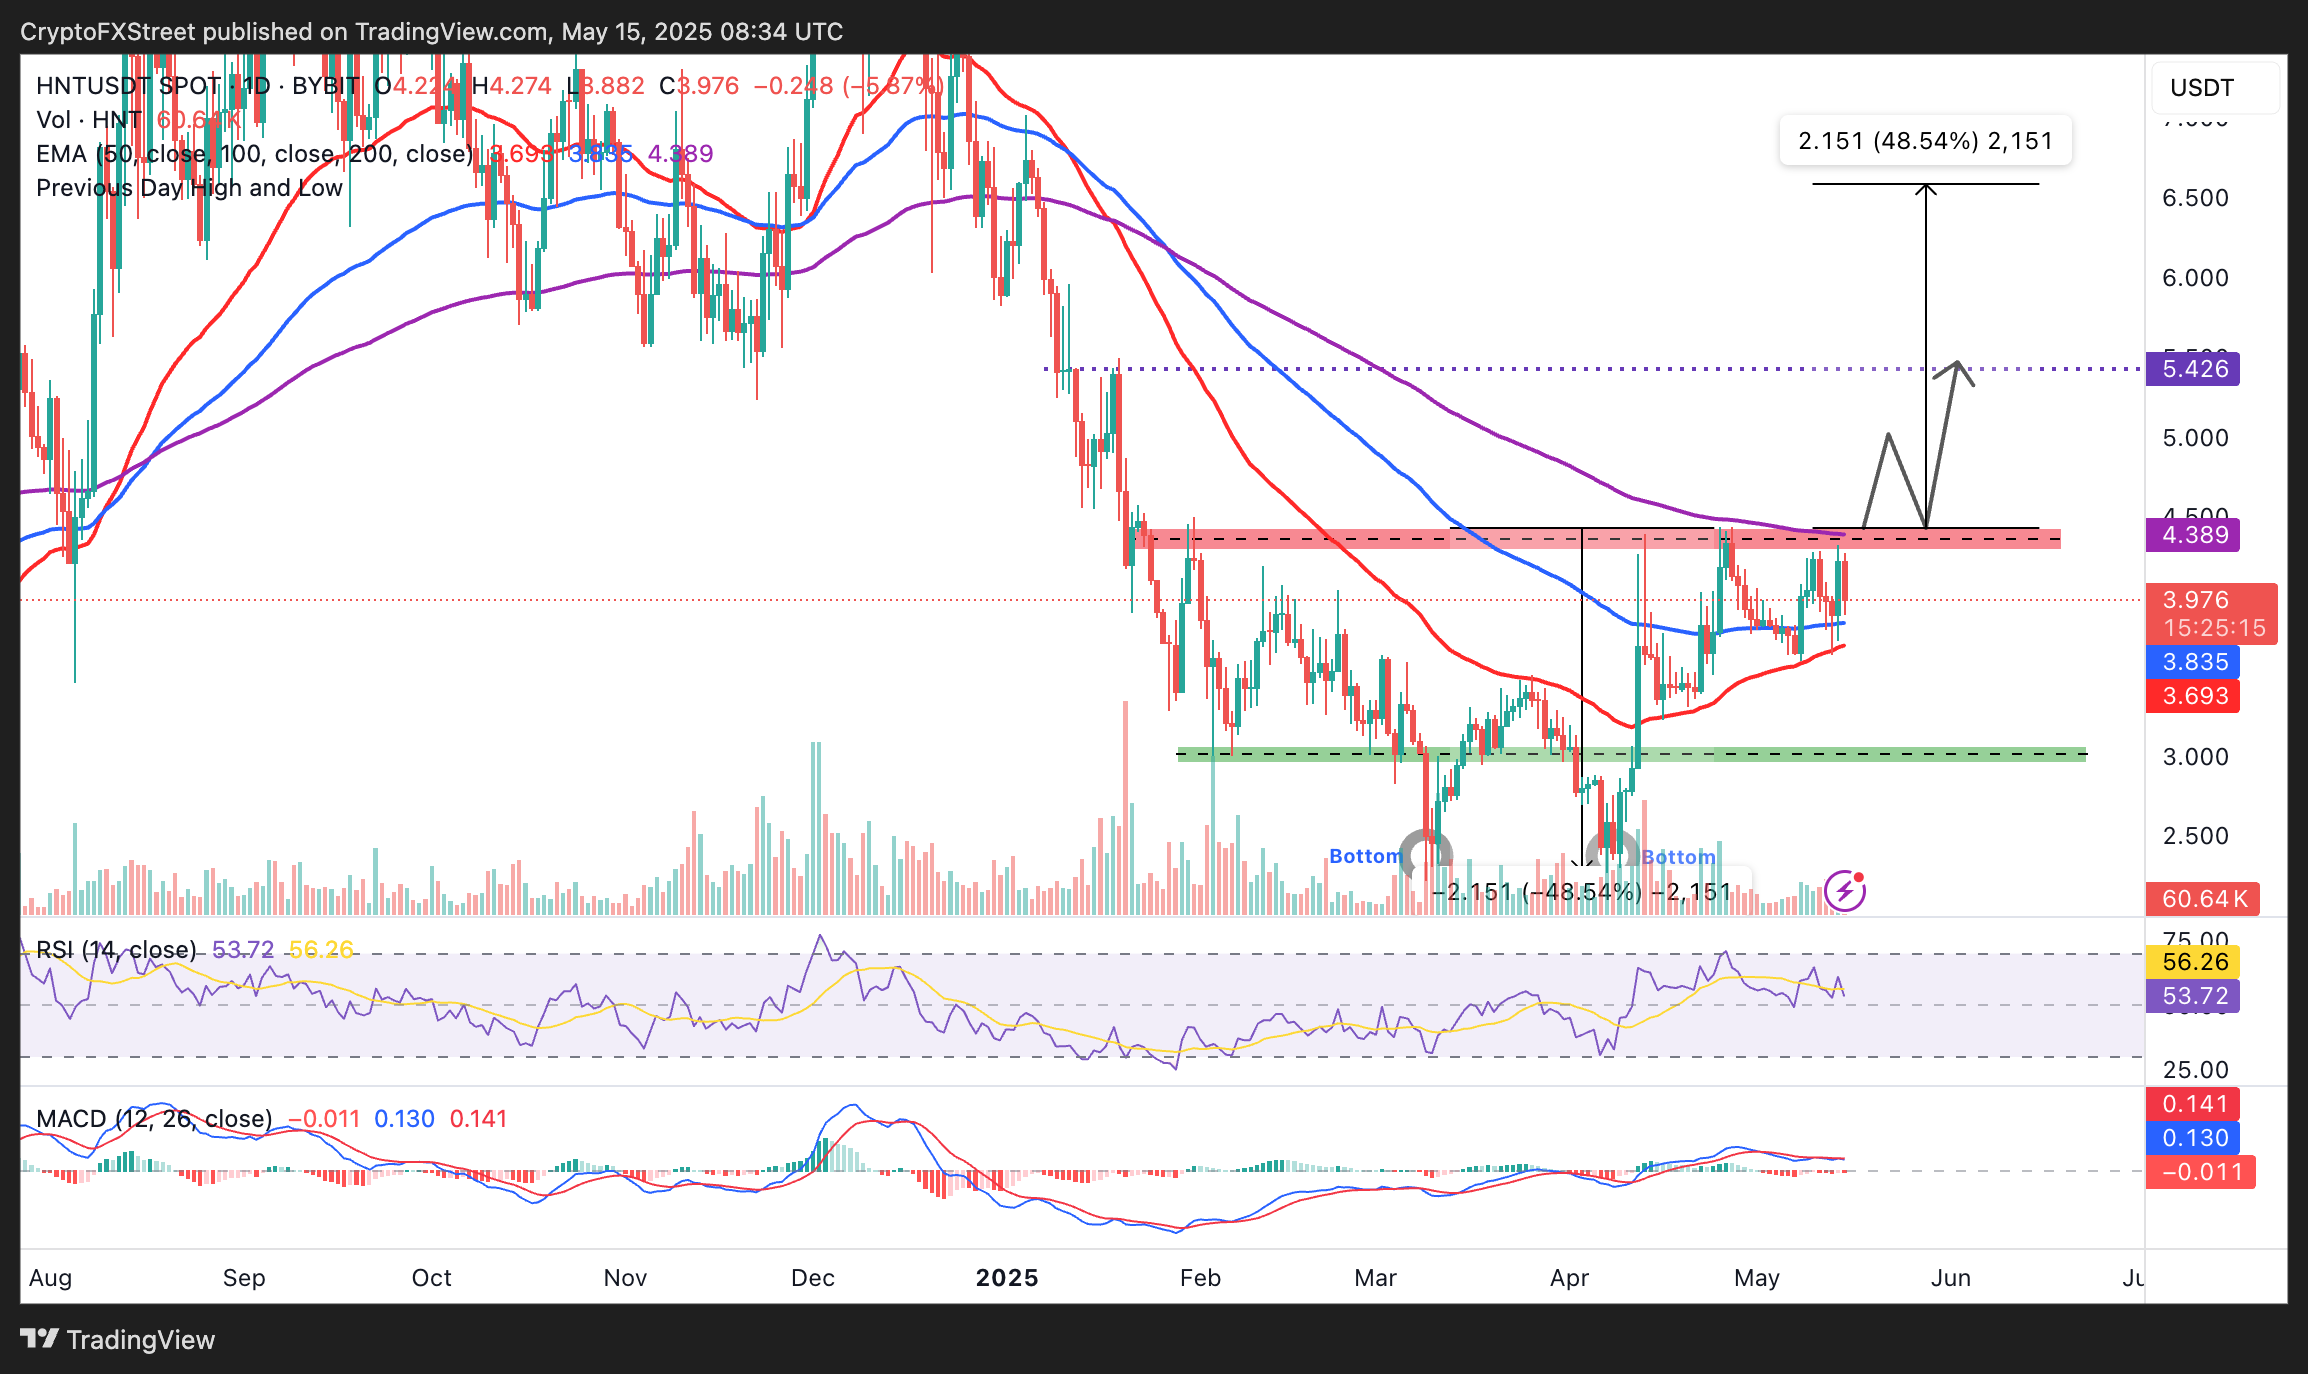
HNT/USD daily chart
Based on the sideways movement of the MACD indicator above the mean line, consolidation could occur between the 100-day support at $3.83 and the 200-day EMA resistance at $4.38 ahead of the next breakout.
Cryptocurrency prices FAQs
Token launches influence demand and adoption among market participants. Listings on crypto exchanges deepen the liquidity for an asset and add new participants to an asset’s network. This is typically bullish for a digital asset.
A hack is an event in which an attacker captures a large volume of the asset from a DeFi bridge or hot wallet of an exchange or any other crypto platform via exploits, bugs or other methods. The exploiter then transfers these tokens out of the exchange platforms to ultimately sell or swap the assets for other cryptocurrencies or stablecoins. Such events often involve an en masse panic triggering a sell-off in the affected assets.
Macroeconomic events like the US Federal Reserve’s decision on interest rates influence crypto assets mainly through the direct impact they have on the US Dollar. An increase in interest rate typically negatively influences Bitcoin and altcoin prices, and vice versa. If the US Dollar index declines, risk assets and associated leverage for trading gets cheaper, in turn driving crypto prices higher.
Halvings are typically considered bullish events as they slash the block reward in half for miners, constricting the supply of the asset. At consistent demand if the supply reduces, the asset’s price climbs.
Information on these pages contains forward-looking statements that involve risks and uncertainties. Markets and instruments profiled on this page are for informational purposes only and should not in any way come across as a recommendation to buy or sell in these assets. You should do your own thorough research before making any investment decisions. FXStreet does not in any way guarantee that this information is free from mistakes, errors, or material misstatements. It also does not guarantee that this information is of a timely nature. Investing in Open Markets involves a great deal of risk, including the loss of all or a portion of your investment, as well as emotional distress. All risks, losses and costs associated with investing, including total loss of principal, are your responsibility. The views and opinions expressed in this article are those of the authors and do not necessarily reflect the official policy or position of FXStreet nor its advertisers. The author will not be held responsible for information that is found at the end of links posted on this page.
If not otherwise explicitly mentioned in the body of the article, at the time of writing, the author has no position in any stock mentioned in this article and no business relationship with any company mentioned. The author has not received compensation for writing this article, other than from FXStreet.
FXStreet and the author do not provide personalized recommendations. The author makes no representations as to the accuracy, completeness, or suitability of this information. FXStreet and the author will not be liable for any errors, omissions or any losses, injuries or damages arising from this information and its display or use. Errors and omissions excepted.
The author and FXStreet are not registered investment advisors and nothing in this article is intended to be investment advice.
Recommended Content
Editors’ Picks

BNB down 5% from peak as Windtree Therapeutics plans $520 million treasury
BNB price is down slightly to trade at $771 on Friday, after correcting from its new record high of $809, reached on Wednesday. The Binance exchange native token is up nearly 20% in July, amid relatively overheated market conditions and institutional adoption.

Crypto Today: Bitcoin declines amid de-risking sentiment, Ethereum and XRP hold key support
Bitcoin sweeps through liquidity around $115,000 level, amid profit-taking and risk-off sentiment. Ethereum rebounds from range low support above $3,500 amid steady ETF inflow.

Ethena eyes 20% gains amid Arthur Hayes 2 million ENA grab, Anchorage Digital deal, new apps
Ethena edges higher by over 20% on Friday as it bounces off a crucial support floor to extend the prevailing bullish run. Arthur Hayes acquires 2.16 million ENA tokens amid Ethena’s partnership with Anchorage Digital to achieve GENIUS Act compliance.

Bitcoin Weekly Forecast: BTC extends correction amid weakening momentum, ETFs outflow
Bitcoin price is slipping below the lower consolidation band at $116,000, a decisive close below to indicate further decline ahead. US-listed spot Bitcoin ETFs show early signs of investor pullback, recording a mild weekly outflow of $58.64 million by Thursday.
Bitcoin: BTC extends correction amid weakening momentum, ETFs outflow
Bitcoin (BTC) is slipping below the lower consolidation band at $116,000, after consolidating for more than ten days. A decisive close below this level would indicate further decline ahead.

The Best brokers to trade EUR/USD
SPONSORED Discover the top brokers for trading EUR/USD in 2025. Our list features brokers with competitive spreads, fast execution, and powerful platforms. Whether you're a beginner or an expert, find the right partner to navigate the dynamic Forex market.