Türkçe
 Español


Bitcoin‘s price surpassed $71,000 several times recently but failed to reach $73,000, facing intense selling pressure. This selling pressure triggered a correction, leading to a sharp decline. Despite this, there are still views in the market that the bull run may not be over.
Bitcoin Daily Chart
TradingRage analyst’s analysis highlights important price levels and sheds light on what might happen to Bitcoin in the coming days.
On the daily chart, BTC struggled to stay above the $66,000 level. According to the analyst, BTC seems to be going through a correction phase. The analyst, considering this not a good sign, noted that Bitcoin recently failed to break out of a descending channel formation, which turned out to be a false breakout.
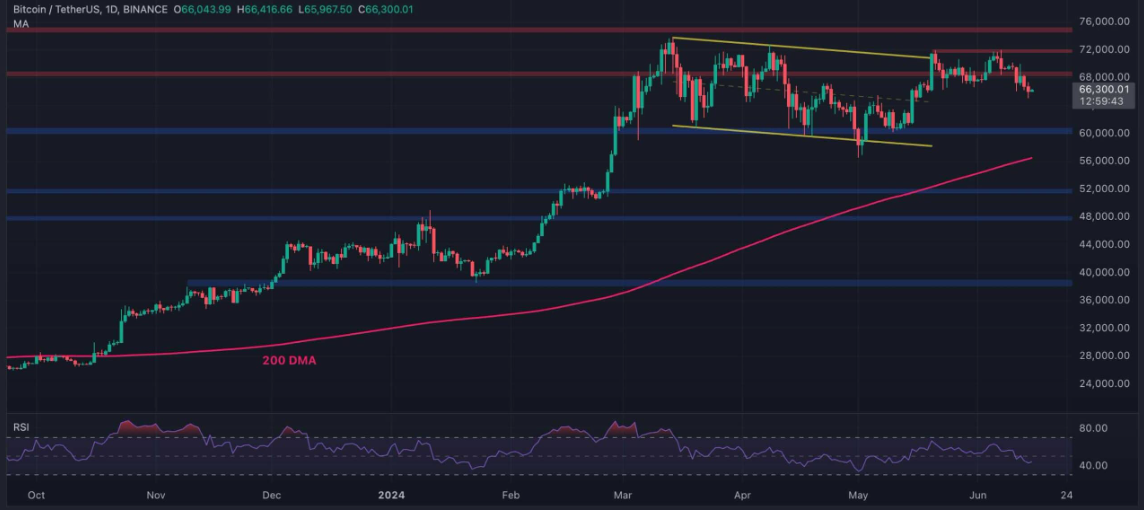

During this period, BTC’s RSI value also fell below 50, indicating that sellers are increasingly dominant. This situation keeps the fear of a deepening downward momentum alive in the market. Meanwhile, the price continues to move at the support level of $60,000.
Bitcoin 4-Hour Chart
On the other hand, when examining the 4-hour chart of BTC, things seem a bit more positive. Although the price fell slightly below the support level of the horizontal channel, it appears to have recovered.
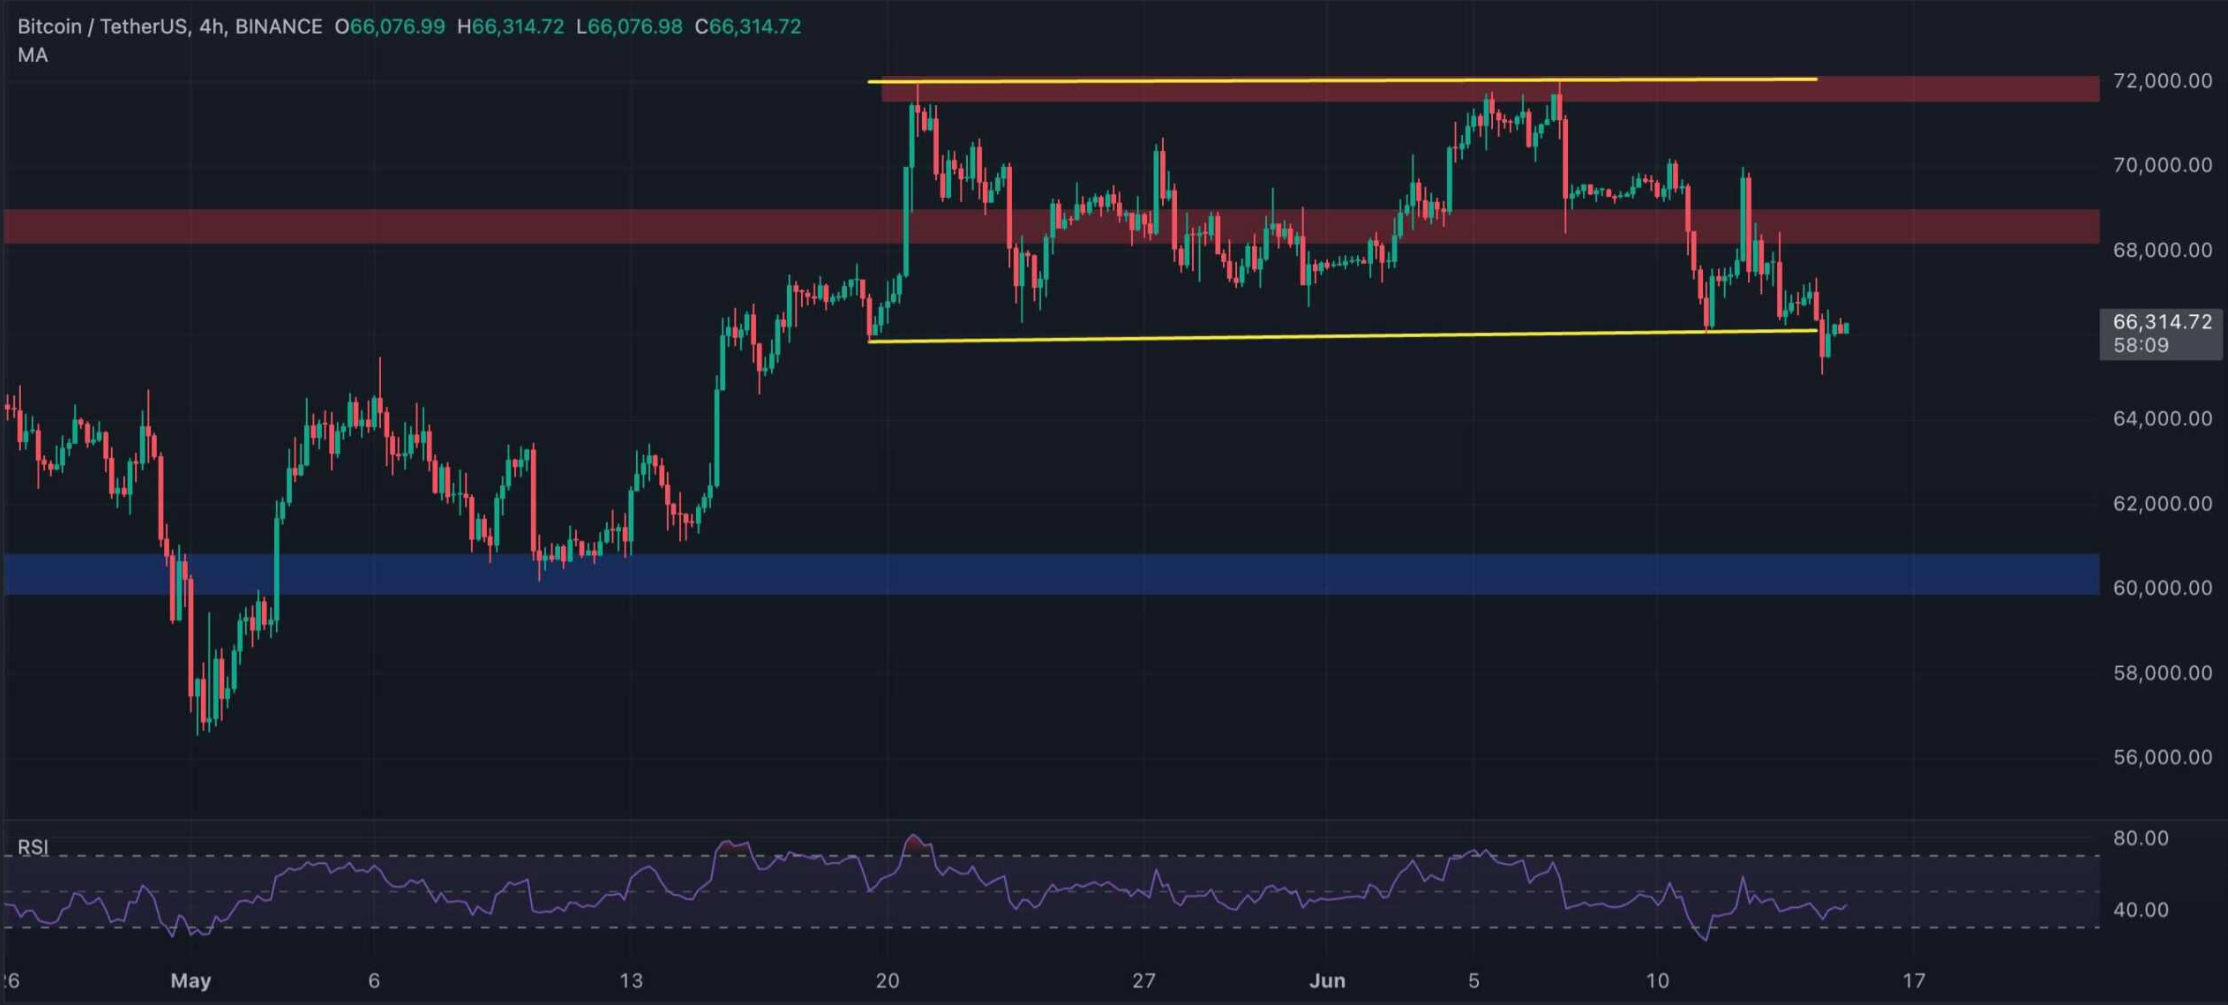
If the price moves within this channel, it could test the resistance area of $72,000 again. However, if the channel breaks downward and sustains, the price decline could deepen further.
As of the time of writing, BTC is at $66,100, finding buyers at $0.06 in the last 24 hours. BTC’s market cap remains above $1.3 trillion, continuing to serve as a critical area.
BTC’s 24-hour trading volume fell to $15 billion after a 43% drop, reflecting a significant decline in investor interest.